
What Is Static Analysis and How It Improves Your Code
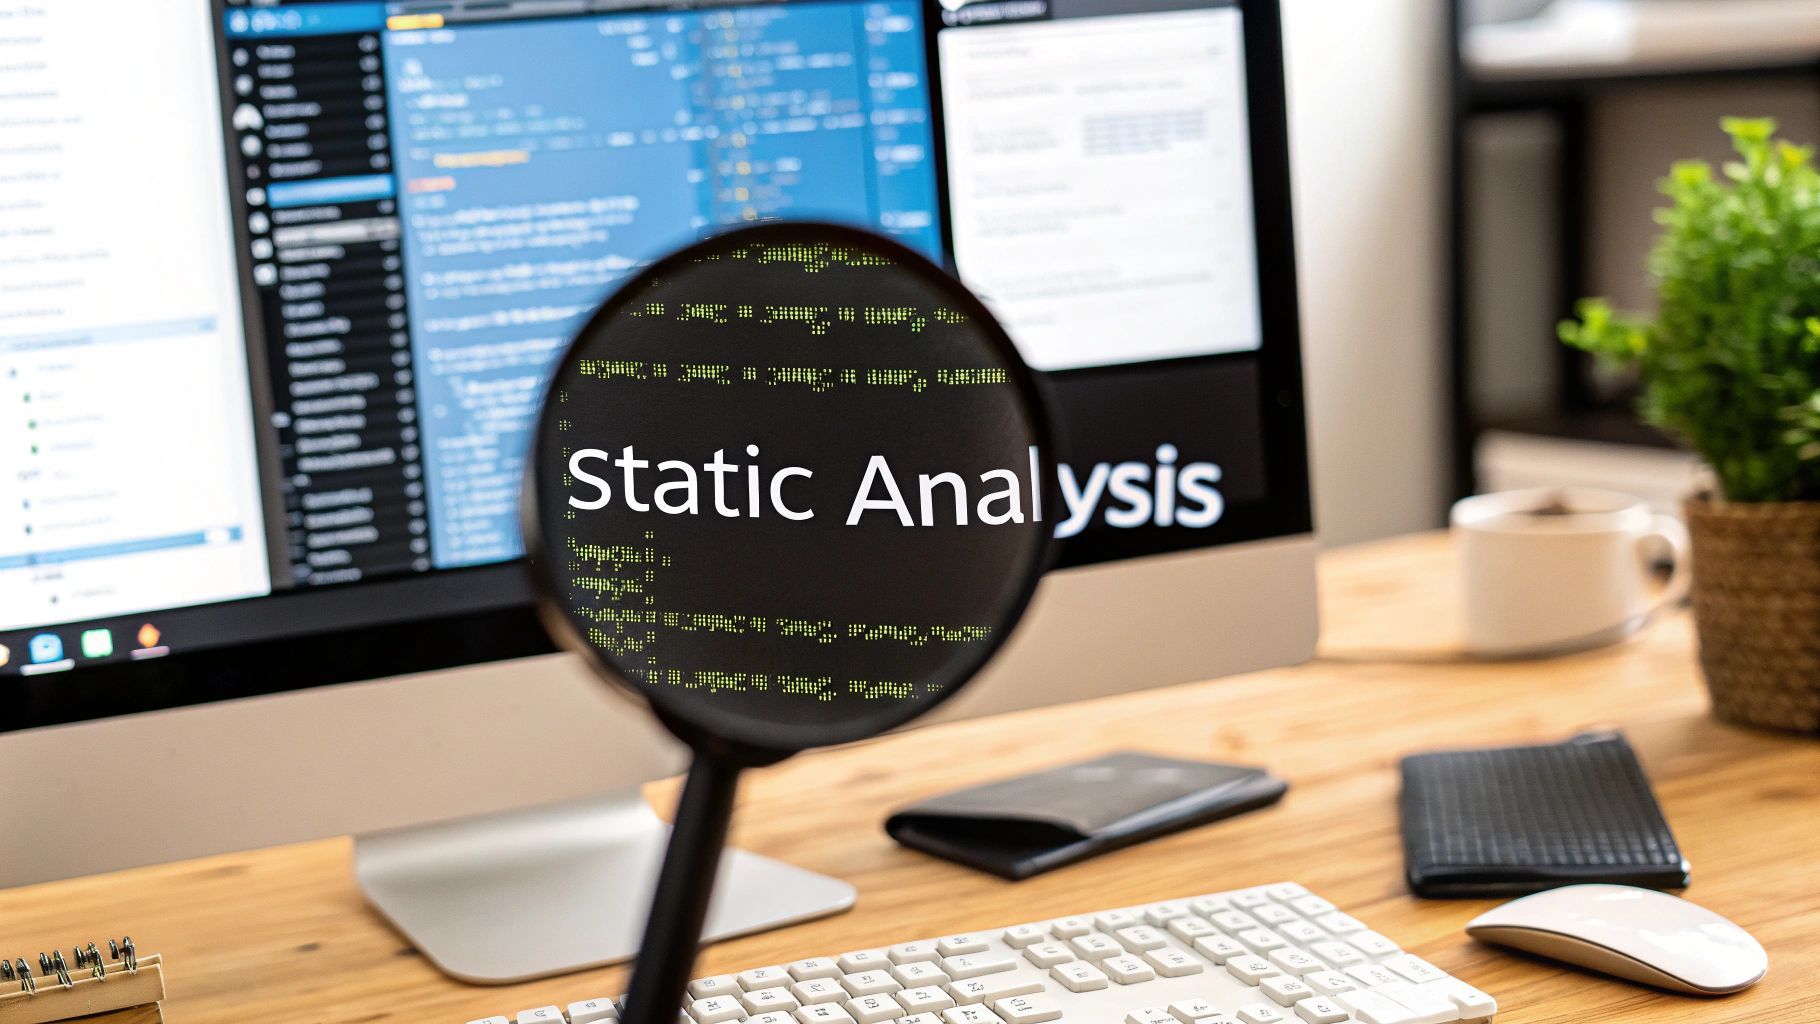
Static analysis is basically a way to automatically check your code for problems without actually running it. Think of it as an incredibly thorough proofreader for your software. It scans every line, looking for potential bugs, security holes, and stylistic mistakes based on a set of predefined rules.
This approach is all about catching issues early in the game, long before they can cause headaches in production. It helps developers ship more reliable and secure code, faster.
The Digital Proofreader for Your Code
So, what is static analysis at its heart? It’s your tireless, automated code review partner. It doesn’t need a coffee break and it inspects every single change with the same level of scrutiny. Instead of waiting for a program to crash or for a user to find a bug, these tools analyze the code’s structure and logic to predict where things might go wrong.
This preventative mindset is a huge part of modern software development. It’s how teams build better applications and avoid costly mistakes down the line.
The idea has been around for a while. It really started gaining traction in the late 1970s. One of the earliest pioneers was a tool called lint), developed by Stephen C. Johnson and released with Version 7 Unix in 1979. It was designed to catch sneaky errors in C programs that compilers often missed. But the real shift happened in the late 1990s and early 2000s. As computers got more powerful, a new generation of tools emerged that could perform much deeper analysis, essentially predicting runtime behavior without ever executing a single line of code. You can learn more about the static analysis market evolution and its significant growth over the years.

To get a better sense of why this is so valuable, it helps to understand what these tools are actually looking for. They go way beyond simple syntax checks.
Here’s a quick summary to give you a clearer picture.
Static Analysis at a Glance
| Concept | Description |
|---|---|
| Code Inspection | The process of analyzing source code without executing the program. |
| Rule-Based | Relies on a set of predefined rules and patterns to identify potential issues. |
| Proactive Quality | Aims to find and fix bugs, vulnerabilities, and style issues early in development. |
| Automation | Designed to be integrated into developer workflows and CI/CD pipelines for continuous feedback. |
This table covers the basics, but let’s dig into the specific kinds of problems these tools are built to find.
Core Principles of Static Analysis
Static analysis tools don’t just find typos; they dig into complex patterns and relationships within your code to flag real problems.
Here’s a breakdown of the key areas they focus on:
- Error Detection: This is the bread and butter. They catch common but painful bugs like null pointer exceptions, resource leaks, or using a variable before it has a value.
- Security Vulnerabilities: A huge win for security. These tools can spot common vulnerabilities like SQL injection or cross-site scripting (XSS) risks long before your code is ever exposed to the real world.
- Coding Standard Adherence: Is everyone on the team following the same style guide? Static analysis enforces consistency in formatting, naming conventions, and structure. This makes the codebase dramatically easier to read and maintain for everyone.
How Static Analysis Actually Works
To really get what static analysis does, it helps to peek under the hood. It’s not just one thing; it’s a whole suite of techniques that work together, inspecting your code from different angles. The process starts with simple style checks and builds up to some seriously complex logical analysis.
Think of it like having a team of specialized inspectors combing through your code. One inspector is a stickler for consistent formatting. Another one acts like a detective, tracing how data travels through your app. A third meticulously maps out every single decision path your code could possibly take. It’s this layered approach that makes static analysis so good at catching a huge variety of problems.
Linting: The Style Guardian
The most familiar type of static analysis is linting. A linter is basically the strict but fair style editor for your codebase. Its main job is to make sure everyone on the team is following the same set of coding standards and conventions.
Linters are great at flagging things that aren’t technically bugs but make code a pain to read and maintain. We’re talking about inconsistent indentation, variables that are declared but never used, or functions that are way too complicated. By automating these checks, linting helps ensure everyone’s code looks and feels the same, which is a massive win for collaboration.
Data Flow Analysis: Following The Information
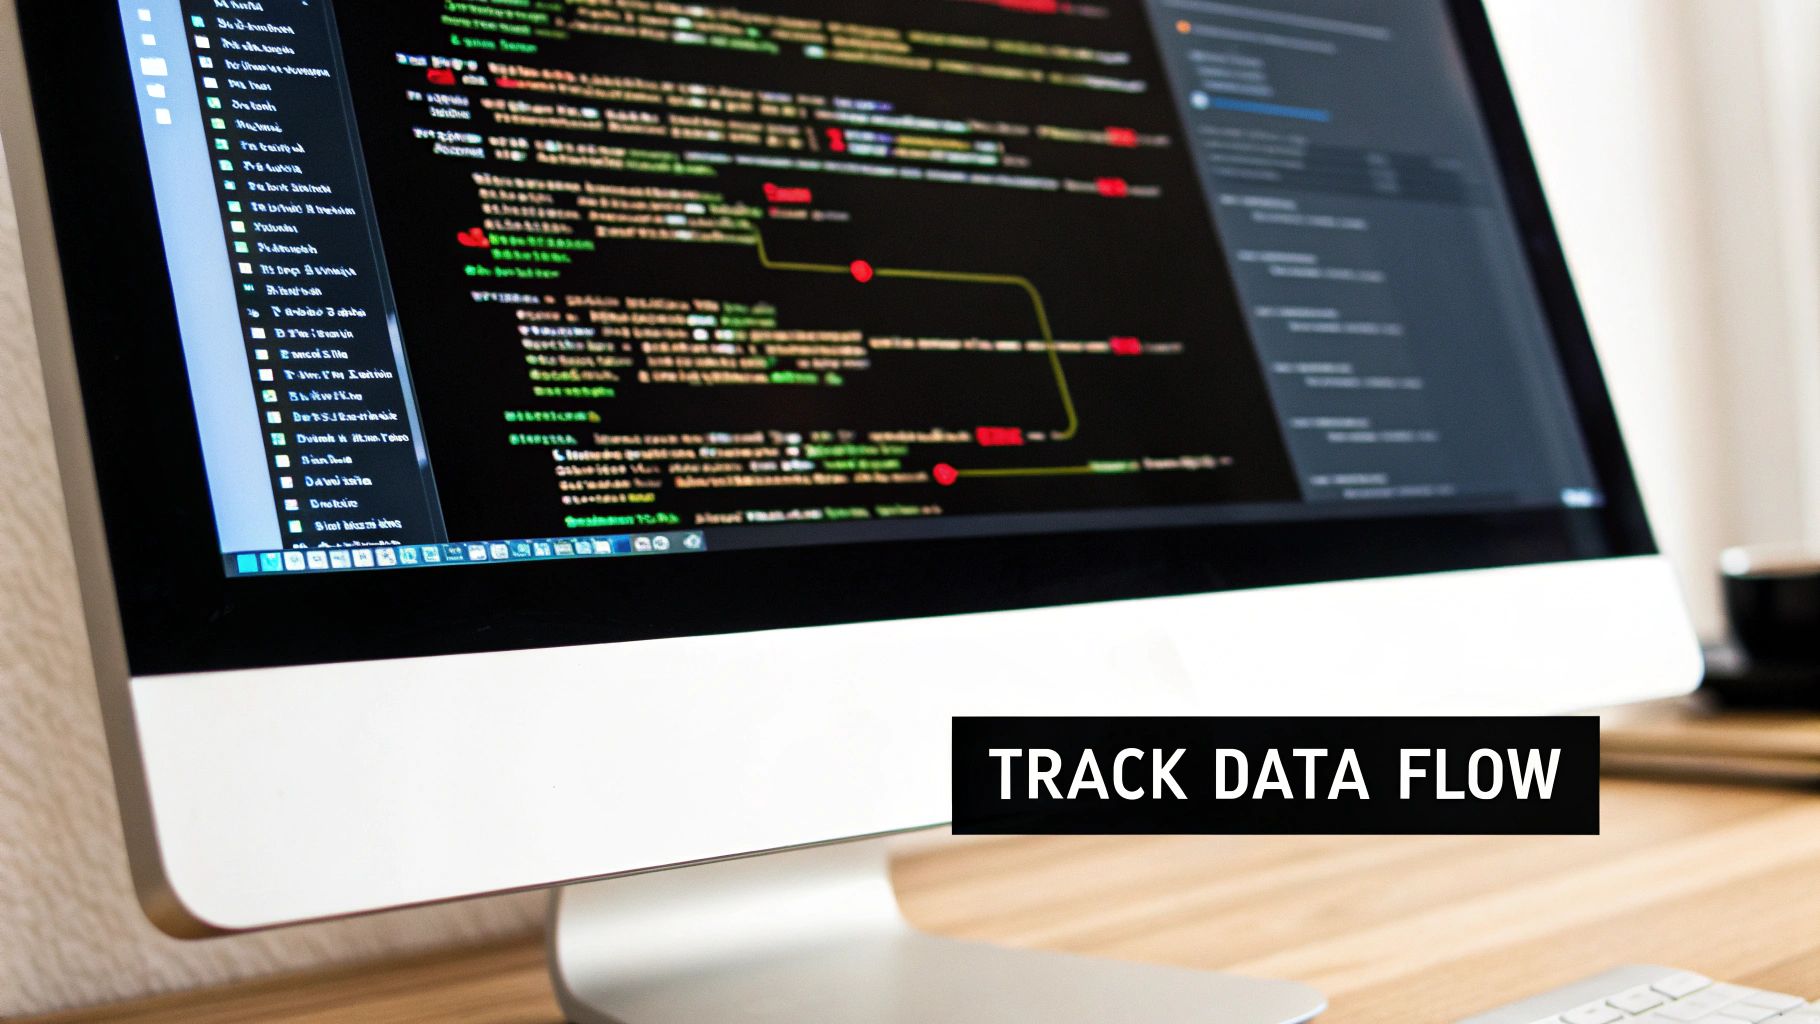
Going a step deeper than style, data flow analysis tracks how data actually moves through your program. It follows a variable from the moment it’s born, through every change it undergoes, all the way to where it’s eventually used or thrown away. It’s like being a detective tracing the path of a crucial piece of evidence.
This technique is incredibly good at finding sneaky, severe bugs that are almost impossible to catch by just reading the code.
- Null Pointer Exceptions: It can see ahead and warn you if a variable might be
nullright before your code tries to use it, preventing a crash. - Resource Leaks: It spots when you open something—like a file or a network connection—but forget to close it.
- Security Flaws: It can flag when untrusted input from a user (say, from a web form) gets used in a risky way, like in a database query, which can lead to injection attacks.
By understanding the entire lifecycle of your data, these tools can uncover logical flaws that would otherwise only show up at runtime—often with some pretty serious consequences.
Control Flow Analysis: Mapping Every Path
Finally, control flow analysis builds a roadmap of every possible execution path your application can take. It looks at all your loops, if-else branches, and function calls to create a graph of all the potential journeys through your code. It’s basically like creating a giant flowchart for your entire program.
By mapping these paths, the analysis can spot unreachable “dead” code—chunks that will never, ever run. More importantly, it helps find overly complex logic (what we call high cyclomatic complexity), which is a huge red flag that a piece of code will be a nightmare to test and riddled with bugs. This analysis makes sure your program’s logic is sound from start to finish.
2. Static vs. Dynamic Analysis: Two Sides of the Same Coin
To really get what static analysis is, it helps to see it next to its counterpart, dynamic analysis. They both have the same goal—making sure your code is solid and secure—but they go about it in completely different ways and at different times. Think of them less as rivals and more as partners in crime-fighting… bug-fighting, that is.
The best analogy I’ve found is building a house.
Static analysis is like the architect poring over the blueprints before any construction starts. They’re looking for design flaws, potential structural weaknesses, or violations of building codes. It’s all about checking the plan before you pour the concrete.
Dynamic analysis, on the other hand, is like the inspection crew that comes in after the house is built. They run the taps to check for leaks, test the electrical circuits under heavy load, and maybe even simulate a minor earthquake to see how the structure holds up. They’re testing the building in action.
A Head-to-Head Comparison
So, one inspects the code at rest, while the other watches it in motion. Each approach has its own unique strengths and catches different kinds of problems. To dig deeper into the technical nuances, this guide on static vs. dynamic code analysis is a great resource.
But for a quick overview, here’s how they stack up.
Comparison of Static vs Dynamic Analysis
This table gives you a clear, side-by-side look at how these two essential testing methods differ in their approach, timing, and what they’re best at finding.
| Attribute | Static Analysis | Dynamic Analysis |
|---|---|---|
| When It Runs | Before the code is even compiled or run—right in the development pipeline. | After the code is built and executing in a real or test environment. |
| What It Needs | Just the source code. That’s it. | A running application, plus specific test cases and data to drive it. |
| Typical Issues Found | Syntax errors, style guide violations, common security flaws (like SQL injection), and unreachable “dead” code. | Runtime errors (like null pointer exceptions), memory leaks, performance bottlenecks, and tricky concurrency bugs. |
| Primary Strength | Finds bugs extremely early and provides 100% code coverage since it examines every single line, regardless of whether it’s executed. | Catches environment-specific or user-driven bugs that are impossible to spot just by looking at the source code. |
| Main Limitation | Can sometimes raise “false positives” (flagging non-issues) and can’t find bugs that only appear at runtime. | It only checks the code paths that are actually run during a test. Untested parts can still hide significant bugs. |
The takeaway here is that you don’t pick one or the other. A modern, effective quality strategy uses both.
Static analysis acts as your first line of defense, cleaning up the source code and preventing common errors from ever making it into a build. Then, dynamic analysis comes in to make sure the running application behaves as expected under real-world stress. Together, they create a powerful, multi-layered approach to shipping high-quality software.
The Real-World Payoff of Static Analysis
Theory is one thing, but the real magic of static analysis happens when you see what it does for a development team’s day-to-day work and the business’s bottom line. Bringing these tools into your workflow isn’t just about ticking a box for new tech; it’s a smart move that pays back in quality, security, and raw speed. It helps you shift from a reactive mode of constantly fighting fires to a proactive one where quality is built in from the start.
When you catch errors the moment they’re typed—or at least before they’re committed—you’re stopping bugs before they can fester and multiply. This early intervention is the secret sauce. It lets your team ship new features with the confidence that you’re not just adding new problems into the mix.
Drastically Better Code Quality
One of the first things you’ll notice is a huge leap in code quality and consistency across the board. Think of static analysis tools as your team’s tireless, automated code sheriff, enforcing the rules you all agreed on. They handle everything from formatting and naming conventions to keeping code complexity in check, making the whole codebase look like it was written by one person with great habits.
This consistency is a game-changer. It makes the code so much easier for everyone to read, understand, and, most importantly, maintain down the road. For engineering managers, this means new hires can get productive faster, and seasoned developers can spend less time untangling messy logic and more time shipping things that matter. It just lowers the mental overhead of working on the project.
By automatically enforcing best practices, static analysis raises the quality floor for the entire team. Excellence becomes the default, not the exception.
A Much Stronger Security Stance
With security being a non-negotiable these days, static analysis is your first line of defense. In the security world, these are often called SAST (Static Application Security Testing) tools, and they’re brilliant at sniffing out common security holes right in the source code. In fact, one of the biggest benefits of static analysis is its central role in building out solid software development security best practices.
They’re trained to spot dangerous patterns that can lead to major breaches, such as:
- SQL Injection Flaws: Stopping attackers from messing with your database.
- Cross-Site Scripting (XSS): Protecting your users from malicious code running in their browsers.
- Insecure Data Handling: Making sure you don’t accidentally leak passwords, API keys, or other sensitive data.
Finding these issues before they ever hit a server is infinitely cheaper and less stressful than cleaning up after a real-world security incident.
Faster, Cheaper Development
Maybe the most persuasive argument for static analysis, especially when talking to the business side, is how it directly impacts speed and cost. Everyone knows that fixing a bug in production is a nightmare. It costs a ton in developer time for bug reports, diagnosis, patching, testing, and deploying a fix. Static analysis flips that script by “shifting left.”
A study that looked at 35 different industrial development projects confirmed that static analysis tools consistently cut down development effort while simultaneously improving code quality. The data even suggests that using these tools effectively can boost a developer’s personal productivity by up to 12.5% by automating the tedious search for subtle defects. You can dive into the full findings on how these tools reduce development effort.
This boost also spills over into code reviews. You can learn more about how automated code reviews make for a smoother workflow. When a tool flags all the simple mistakes and style issues first, your human reviewers can save their brainpower for the tricky architectural decisions and business logic. The whole review cycle gets faster and a lot more valuable.
How to Integrate Static Analysis into Your Workflow
Knowing what static analysis can do is one thing, but actually weaving it into your daily work is where the magic happens. The real goal is to create a super-tight feedback loop—one where problems are found and fixed almost as soon as they’re created. This turns quality checks from a tedious chore into a simple, automated reflex.
The idea isn’t to bolt on another slow, cumbersome step. It’s about embedding automated checks at the two most logical points in the development cycle: right inside your editor as you code, and just before anything gets merged into your main branch.
Get Instant Feedback in Your IDE
The absolute fastest way to fix a bug is to catch it the second you type it. This is why plugging static analysis tools directly into your Integrated Development Environment (IDE) is such a game-changer. It’s like having a sharp-eyed pair programmer looking over your shoulder, gently pointing out mistakes in real-time.
Modern editors like VS Code, the JetBrains suite, or Cursor are packed with extensions for popular static analysis tools. Just install the right plugin for your stack—think ESLint for JavaScript or Pylint for Python—and you’ll get immediate feedback. Errors, potential security holes, and style issues get highlighted with that familiar red squiggly line, just like a spellchecker in a word processor.
This immediate feedback is incredibly powerful. It doesn’t just stop simple bugs from ever getting committed; it also subtly trains developers to write better code by showing them instant, contextual corrections.
Automate Quality Gates in Your CI/CD Pipeline
While IDE integration is fantastic for individual developers, automating static analysis in your CI/CD pipeline is what protects the whole team. This step acts as a quality gate, making sure that buggy or insecure code can’t sneak into your main repository.
Here’s a typical flow:
- A developer pushes their code and opens a pull request.
- The CI server (like GitHub Actions, GitLab CI, or Jenkins) automatically kicks off a build.
- As part of that process, a static analysis tool scans the new code.
- If the scan finds critical issues or the code quality drops below a defined threshold, the build fails.
This simple process makes quality non-negotiable. The pull request is physically blocked from being merged until the developer fixes the flagged issues. It turns your CI/CD pipeline from a simple build-and-deploy machine into a vigilant guardian of your codebase’s health. It’s a key piece of any effective automatic code review strategy, letting the machines handle the nitpicky stuff.
This approach delivers three core benefits across the board: better quality, tighter security, and faster development cycles.

By embedding these checks, you’re catching problems and improving your code long before it ever has a chance to reach production.
Configure Rulesets to Reduce Noise
One of the most common ways teams stumble when adopting static analysis is by turning on every single rule from the get-go. This almost always unleashes a firehose of warnings, creating “alert fatigue” and causing developers to just ignore the output.
The key to a successful rollout is to start small and customize your ruleset.
Begin with a curated set of high-impact rules that focus on critical bugs and glaring security vulnerabilities. Once the team is used to that, you can gradually introduce more rules around code style and best practices. Most tools give you fine-grained control to tweak or disable rules, so you can make sure the feedback is always relevant and actionable, not just background noise.
Choosing the Right Tools and Best Practices
A great tool is one thing, but knowing how to use it is what really counts. When it comes to static analysis, picking the right tool for your tech stack and adopting some solid best practices is how you turn a good idea into a massive win for your team.

Finding the Best Tool for the Job
The world of static analysis tools is huge. There are options for nearly every language, framework, and team size out there. The trick is finding one that fits snugly into your existing workflow, giving you actionable feedback without adding a bunch of noise.
Here are a few popular and battle-tested choices:
- ESLint: If you’re working with JavaScript or TypeScript, ESLint is the gold standard. It’s incredibly flexible, perfect for enforcing style guides, catching common mistakes, and keeping your frontend and Node.js projects consistent.
- SonarQube: Think of SonarQube as the all-in-one platform for big projects. It supports over 30 programming languages and goes way beyond simple linting to give you a deep dive into code quality, security vulnerabilities (SAST), and complexity.
- Pylint: For Python developers, Pylint is a go-to. It’s fantastic at spotting programming errors, enforcing coding standards, and flagging overly complex code that needs a second look.
- Checkstyle: A true classic in the Java community, Checkstyle is all about making sure your code sticks to a defined standard. This is absolutely essential for keeping large Java applications readable and maintainable.
If you’re weighing your options, our guide on some of the best code review tools like SonarQube, Codacy, and DeepCode can help you compare what’s out there.
Best Practices for Maximum Impact
Just flipping the switch on a static analysis tool won’t magically solve all your problems. To get real value and avoid driving your developers crazy, your team needs to agree on a few habits that make analysis a helpful partner, not a noisy distraction.
The ultimate goal is to create a high signal-to-noise ratio. Every warning a developer sees should be a real, actionable issue that they feel empowered to fix immediately.
First, treat warnings as errors in your CI/CD pipeline. This might sound harsh, but it’s a game-changer. It makes quality a non-negotiable part of your process and stops buggy code from ever getting merged.
Second, customize the ruleset to kill false positives. Don’t just turn on every rule in the book. Start with a small, high-confidence set of rules and add more over time. If a rule is consistently flagging things that aren’t real issues, tune it or turn it off. Otherwise, you risk “alert fatigue,” where everyone just starts ignoring the tool.
Finally, when you’re adding analysis to an older, existing codebase, focus on new and changed code first. Trying to fix thousands of legacy issues at once is a recipe for disaster. Most tools can be configured to only scan new code, letting you raise the bar for quality going forward without getting bogged down by the past.
Frequently Asked Questions About Static Analysis
Whenever a team starts weaving static analysis into their workflow, the same questions tend to surface. Getting these sorted out early on helps everyone get on the same page and sets the stage for a much smoother rollout.
Let’s tackle some of the most common ones to clear up any confusion and help you get the most out of these tools.
Can Static Analysis Find Every Single Bug?
In a word, no. It’s important to have realistic expectations here. Static analysis is a fantastic tool, but it’s not a silver bullet that makes all bugs disappear.
It’s brilliant at catching well-known error patterns, code style slip-ups, and common security holes based on the rules it knows. What it can’t do is spot tricky business logic errors or bugs that only pop up at runtime with specific user data or when talking to another service.
Think of it as one essential part of a bigger quality plan. You still absolutely need your unit tests, integration tests, and dynamic analysis to catch the rest.
How Do I Deal with All These False Positives?
This is probably the biggest hurdle teams face, and if you don’t handle it right, developers will start ignoring the tool altogether. The key is to be deliberate about your configuration.
When you first turn on a tool, it can feel like opening a firehose of warnings, many of which might not even matter for your project. This “alert fatigue” is a real problem.
The best approach is to start small. Begin with a core set of high-impact, high-confidence rules and then gradually add more over time. Modern tools are highly configurable, letting you turn off rules that don’t fit your team’s style, adjust their sensitivity, or even ignore a warning on a specific line of code with a comment. The goal isn’t to have zero warnings; it’s to make sure every warning you do see is worth fixing.
How Does Static Analysis Fit in with AI Coding Assistants?
They’re a fantastic combination—one that creates a really tight feedback loop for developers.
Think of it this way: the static analysis tool is your automated inspector, tirelessly scanning your code and flagging potential issues with machine precision.
The AI assistant then acts as your expert consultant. It can explain why something was flagged, walk you through the potential consequences, and often suggest the exact code change to fix it. This duo doesn’t just produce better code; it helps developers learn and improve on the fly by giving them instant, contextual feedback.
Master Your Static Analysis Workflow
Turn your static analysis tools from a noisy distraction into a powerful, automated partner for shipping high-quality code.
📊 Core Metrics
- Bugs Caught Pre-Commit — Issues flagged by IDE plugins before code is ever committed.
- CI Build Failures — Number of builds blocked by quality gates, preventing bad merges.
- False Positive Rate — Percentage of warnings developers override or ignore, a sign to tune rules.
🕹️ My Cheatcodes
- 🌱 Start Small — Begin with a minimal, high-impact ruleset and expand slowly to avoid alert fatigue.
- 🔒 Gatekeeper Mode — Configure your CI/CD pipeline to fail builds on critical analysis warnings. No exceptions.
- ⚡ Focus on New Code — Apply strict rules to new/changed code first, tackling legacy debt incrementally.
📈 Reflection Points
- 💡 Are developers ignoring warnings? If so, is it because of noise or workflow friction?
- 🧩 Does our current ruleset accurately reflect our team's coding standards and priorities?
- 📘 How can we use AI coding assistants to interpret and fix the issues our tools find?
Gallery
Lemon shots



