What Is Cycle Time in Software Development and How to Reduce It

So, what exactly is cycle time?
In software development, it’s the total time that passes from the moment a developer starts actively coding a new feature to the second that code is deployed and live for users.
Think of it like ordering a pizza. The cycle time isn’t just how long it takes to bake. It’s the entire stretch from when the chef first tosses the dough to the moment the hot, finished pizza lands on your table. It includes the prep, the baking, the slicing, and even the short wait on the counter before it’s served.
What is Cycle Time? The Core Engine of Development Speed

At its heart, cycle time is a simple but incredibly powerful metric. It measures the total elapsed time it takes for a piece of work to move through your entire development pipeline. This isn’t just about active coding time; it includes every single step. We’re talking coding, testing, code review, and deployment—plus all the waiting periods in between.
That’s what makes it so insightful. It gives you a true, unfiltered look at your team’s end-to-end speed.
A short and predictable cycle time is a sign of a healthy, efficient team. It means you can ship value to customers quickly, get their feedback faster, and pivot when the market demands it. On the flip side, a long and unpredictable cycle time often signals hidden bottlenecks, friction in your process, and delays in getting your hard work into the hands of users.
It’s More Than Just a Number
Understanding cycle time is about more than just a figure on a dashboard. It’s a diagnostic tool for your entire engineering process. When you start tracking it, you suddenly gain visibility into crucial areas:
- Process Bottlenecks: Where does work actually get stuck? Is it waiting days for a code review? Piling up in a deployment queue? Blocked on the testing team?
- Team Efficiency: How quickly can your team take a well-defined idea and turn it into a shipped feature that customers can use?
- Feedback Loop Speed: Shorter cycles mean you hear from real users faster. That feedback is gold for building products people actually want.
- Predictability: When your cycle time is stable, you can make much more accurate forecasts and plans. No more wild guessing.
To really get it, you have to break the process down. The cycle isn’t one monolithic block of time; it’s a series of distinct phases where work is either being actively done or is just sitting and waiting.
The Four Key Phases of Cycle Time
| Phase | Description | Example Activities |
|---|---|---|
| Coding Time | The time a developer actively spends writing, refactoring, and committing code to solve the problem. | Writing functions, creating UI components, fixing bugs, running local tests. |
| Review Time | The period from when a pull request (PR) is opened until it’s approved and ready to be merged. This includes wait time. | Waiting for a reviewer, addressing feedback, making revisions to the PR. |
| Merge & Test Time | The time it takes for the approved code to be merged into the main branch and pass all automated tests in the CI/CD pipeline. | Merging PR, running integration tests, waiting for build to complete. |
| Deployment Time | The final step, from when the code is ready to deploy until it’s successfully running in the production environment. | Waiting in the deployment queue, running the deployment script, smoke testing in production. |
Looking at the process this way helps you pinpoint exactly where the delays are happening. Is your “Review Time” a black hole? Is the “Deployment Time” surprisingly long? That’s where you need to focus your efforts.
How Cycle Time Plays Out in the Real World
In modern software development, the definition is crisp: it’s the time from the first commit on a task until that change is running in production.
Unfortunately, industry data shows that for many teams, this process is still painfully slow. Almost 40% of developers report that it takes them one to two weeks to get a feature from idea to deployment, meaning their cycle time is somewhere between 7–14 days. You can dig into more of these numbers by checking out these software development statistics on allstacks.com.
The rise of AI-assisted coding is throwing a new spotlight on this metric. Tools like GitHub Copilot are helping developers write the initial code faster than ever before. But if the code then sits for a week waiting for review, you haven’t really gained much.
This is why tracking the full cycle time is more critical than ever. It ensures that the productivity boosts from AI actually translate into faster delivery and real business value, not just faster pull requests.
Why Cycle Time Is a Game Changer for Engineering Teams
Knowing what cycle time is is the first step. But understanding why it matters is what separates a good engineering team from a great one. Getting your cycle time down isn’t just about making developers more efficient; it’s a direct path to driving real business results and building a healthier, more motivated team.
When you can ship code faster, you get feedback from actual users faster. This creates a tight feedback loop, which is pretty much the lifeblood of modern product development. Instead of building in a bubble for months on end, you release small, valuable pieces, learn what works, and adjust on the fly. That kind of agility is a massive competitive advantage.
From Engineering Metric to Business Driver
A short cycle time means you can out-innovate competitors, react quickly to changes in the market, and get value into your customers’ hands before anyone else does. Every single day you can shave off your cycle time is another day you’re learning and improving while the competition is still stuck in development. This changes the perception of engineering from a cost center to a strategic engine for growth.
High-performing teams, especially those considered “elite” by the DevOps Research and Assessment (DORA) metrics, are obsessed with this idea. They don’t see cycle time as just another number on a dashboard; they see it as a primary indicator of their overall health and delivery speed. For them, a consistently low cycle time is a clear sign that the whole system—from planning all the way to deployment—is running smoothly.
A long cycle time is more than just a delay; it’s a hidden tax on your business. It represents delayed revenue, missed market opportunities, and the compounding cost of developer time spent waiting instead of creating.
When teams focus on shortening their cycle time, they aren’t just chasing a speed metric for the sake of it. They’re tackling a measurable business driver that directly impacts cost, risk, and how competitive they can be. The global software development market was valued at about $659 billion in 2023. With that much money at stake, time is one of the most expensive resources. Yet, typical custom software projects still take 4–5 months to deliver, and a staggering 31% of projects actually finish on time, on budget, and with everything they were supposed to have. As you can read in this analysis of software development trends on machonedigital.com, every extra week a feature spends in development is another week of lost revenue and slower learning.
The Impact on Team Morale and Focus
Beyond the numbers, slashing your cycle time has a huge, positive effect on your developers. Engineers want to see their work have an impact. Frankly, nothing kills motivation faster than finishing a feature only to see it sit in a review queue for days or get stuck in a tangled deployment process for weeks.
Frequent, successful deployments build a powerful sense of momentum and accomplishment. Shipping work feels good. It validates all the hard work and tough problems that were solved to get it done. A short cycle time keeps developers connected to the real-world impact of their code.
This creates a powerful, positive feedback loop:
- Faster shipping leads to more frequent wins.
- Frequent wins boost morale and keep the team engaged.
- Engaged teams actively look for ways to improve their own processes.
- Improved processes lead to even faster shipping.
At the end of the day, a low cycle time is a symptom of a healthy engineering culture. It shows that a team values collaboration, has streamlined its code review and testing, and has automated away the tedious, manual work that causes delays. It’s the clearest signal that your team is built to move fast, learn quickly, and win.
How to Accurately Measure Your Team’s Cycle Time
You can’t fix what you can’t see. Knowing what cycle time is matters, but actually measuring it is where the rubber meets the road. The good news? The formula itself is dead simple, and you already have the data you need.
At its core, the calculation for any single piece of work is just this:
Cycle Time = Deployment Timestamp – First Commit Timestamp
That’s it. This formula gives you the total calendar time—including nights and weekends—from the moment a developer first saves their code for a task to the second it’s live for your users. It’s an honest, unfiltered look at how long your entire process takes.
Defining Your Start and End Points
The hardest part of measuring cycle time isn’t the math; it’s getting everyone on the same page about what counts as “started” and “done.” For this metric to mean anything, you have to measure it the exact same way for every task, every single time.
- Start Point (First Commit Timestamp): This is the timestamp from the very first Git commit tied to a specific ticket, feature, or bug fix. It’s the real “pencils down, code up” moment. Using the first commit is so much more reliable than relying on a project management ticket being dragged to “In Progress,” which often happens inconsistently or long after the work actually began.
- End Point (Deployment Timestamp): This is the moment the code is officially deployed to your production environment. Value has been delivered.
Nailing down these two goalposts is everything. Without that alignment, you’re just comparing apples to oranges, and your data won’t tell you anything useful.
A Practical Example of Calculating Cycle Time
Let’s see how this plays out in a real-world scenario. Imagine a developer, Alex, picks up a ticket to add a new “Export to CSV” button to a dashboard.
- First Commit (The Start): Alex starts coding on Tuesday at 9:00 AM. After getting the basic button UI in place, Alex makes the first commit with the message “feat: add initial CSV export button UI.” That commit’s timestamp is our starting line.
- Development and Review: Over the next couple of days, Alex builds out the feature, opens a pull request, and gets it reviewed and approved by the team.
- Deployment (The End): The approved code is merged into the main branch and deployed to production on Thursday at 5:00 PM. The timestamp of that successful deployment is our finish line.
To get the cycle time, we just measure the time between those two points. From Tuesday at 9 AM to Thursday at 5 PM is a total of 56 hours. That’s the cycle time for this feature.
Calculating Your Team’s Average Cycle Time
Knowing the cycle time for one task is interesting, but the real power comes from tracking your team’s average over time. To do this, you just collect the cycle time for every task completed in a given period—say, a two-week sprint or a full month—and then find the average. If you want to go deeper on this, you can learn more about how to calculate cycle time in our dedicated guide.
By tracking this average, you move from hunches like “I feel like we’re shipping faster” to data-driven proof. A dropping average cycle time is one of the clearest signs that the improvements you’re making are actually working.
Your best data sources here are your version control system (Git, for example) for commit timestamps and your CI/CD platform for deployment times. Tools like Jira or Linear can supplement this, but Git history is almost always the most reliable source of truth for when coding actually begins.
Cycle Time vs Lead Time vs Throughput
In the world of software development metrics, three terms often get tangled up: cycle time, lead time, and throughput. It’s easy to see why. They all measure aspects of “speed,” but they tell very different stories. Getting them straight is the first step to figuring out what’s actually holding your team back.
Let’s use an analogy. Imagine you’re ordering a custom-built car.
The entire process, from the moment you sign the paperwork to the day the keys are in your hand, is the lead time. This is what you, the customer, experience—the total wait.
But the cycle time is the period from when the first piece of metal is welded on the assembly line to when the car rolls off, fully built and ready for delivery. This is the factory’s perspective—the actual build time.
And throughput? That’s just how many finished cars the factory manages to ship out in a given week. It’s a measure of output, not the speed of a single car’s build.
Understanding the Customer View vs The Developer View
The most important distinction to nail down is the one between lead time and cycle time. They might sound similar, but they measure things from two completely different viewpoints.
- Lead Time is the customer-facing metric. It starts the second a request is officially accepted and logged. It includes all that time the ticket spends sitting in a backlog, waiting to be prioritized, or being discussed in planning meetings—before a developer ever writes a single line of code.
- Cycle Time is the developer-facing metric. It only kicks in when a developer actually starts the work, which is usually marked by the first commit. It purely measures the efficiency of your internal development machine: coding, reviewing, testing, and deploying.
Because of this fundamental difference, your lead time will almost always be longer than your cycle time. A massive gap between the two is a classic sign of a bottleneck in your planning or prioritization process, not necessarily a slow engineering team. To dig deeper into this customer-centric metric, you can read more about improving lead time in software development.
This timeline zeroes in on the development cycle itself, showing how it focuses on the active build phase.

As you can see, cycle time gives you a clean, focused look at your team’s execution speed once a task is actually in their hands.
Throughput: The Measure of Output
While cycle and lead times are all about speed, throughput is about capacity. It answers the simple question, “How much stuff are we actually getting done?” We usually track it as the number of tickets, user stories, or pull requests completed per week or sprint.
Throughput is incredibly valuable for understanding your team’s sustainable pace and for making better forecasts. If you know your team consistently completes about 8 tasks a week, you can predict with much more confidence how long it will take to get through a backlog of 40 tasks.
Many modern project management methodologies are built around tracking and optimizing these kinds of metrics, helping teams find a predictable rhythm.
Cycle Time vs Lead Time vs Throughput at a Glance
It can be a lot to keep straight, so here’s a simple table to break down the core differences between these three essential metrics.
| Metric | What It Measures | Start Point | End Point | Primary Use Case |
|---|---|---|---|---|
| Cycle Time | The speed of the internal development process. | First code commit on a task. | Code is live in production. | Diagnosing engineering process bottlenecks and improving team efficiency. |
| Lead Time | The total time the customer waits for a feature. | A work request is officially accepted. | The feature is delivered to the customer. | Understanding the end-to-end customer experience and improving overall value delivery. |
| Throughput | The total quantity of work completed. | Start of a time period (e.g., Monday). | End of a time period (e.g., Friday). | Measuring team capacity and forecasting future work completion. |
Knowing when to use each metric is key. Use cycle time when you’re talking about internal engineering efficiency. Bring up lead time when the conversation is about the customer experience. And lean on throughput when you need to discuss team capacity and planning.
Okay, you know your cycle time. The next step? Actually shrinking it. This is where the real magic happens.
Reducing cycle time isn’t about pressuring developers to type faster or work weekends. It’s about finding and eliminating the friction in your development process. It’s about creating a smooth path for great ideas to become production-ready code without all the wasted effort in between.
The real goal is a predictable, steady flow of work. To get there, you have to attack the waiting periods. Think about all the time code just sits around—in a queue for review, waiting for tests to pass, or lined up for deployment. These are almost always the biggest culprits behind a bloated cycle time.
Let’s look at a few proven strategies to cut down these delays and get your team shipping faster.
Embrace Smaller Batches
One of the single most effective ways to slash cycle time is to work in smaller pieces. We’ve all seen those massive, monster pull requests (PRs). They’re a classic bottleneck. They’re a nightmare to review, a headache to test, and risky to merge, which means they inevitably get stale sitting in the review queue for days, quietly wrecking your cycle time.
Breaking big features into smaller, independent chunks creates a powerful ripple effect:
- Faster Code Reviews: A small, focused PR is a gift to your teammates. It’s so much easier to review quickly and thoroughly, shrinking review time from days to hours.
- Lower Cognitive Load: Reviewers can wrap their heads around a single, clear change instead of trying to parse thousands of lines of code at once.
- Reduced Merge Risk: Merging a small change is far less likely to break something or cause nasty merge conflicts. The whole process just feels safer and runs smoother.
Shifting to a “small PR” culture is a fundamental change, but it directly targets the biggest waiting game in most development cycles.
Optimize Your CI/CD Pipeline
Think of your Continuous Integration and Continuous Deployment (CI/CD) pipeline as the assembly line for your code. A slow, flaky pipeline is like a brake pedal stuck to the floor, artificially inflating your cycle time. Every single minute your team spends waiting for a build to finish or a test suite to run is pure waste.
To really get things moving, take a hard look at your setup and implement some solid CI/CD pipeline best practices. Focus on easy wins like running tests in parallel, caching dependencies, and optimizing your build steps. A fast, reliable pipeline means that once code gets the green light, it’s deployed in minutes, not hours.
Implement Feature Flags
Feature flags (or toggles) are an incredible technique for separating deployment from release. They let you merge and deploy new code into production that’s “switched off” for users until you’re ready. This completely changes the cycle time equation.
With feature flags, teams can continuously merge small, unfinished pieces of a bigger feature into the main branch. This gets rid of long-lived feature branches, which are a notorious source of merge conflicts and delays.
This approach keeps momentum high and your main branch in a constant state of “ready to go.” It lets you shorten the cycle for every individual code change without having to wait for an entire epic feature to be 100% complete.
Supercharge Your Workflow with AI
Modern AI coding assistants are here, and they’re a game-changer for the “coding” part of the cycle. These tools can dramatically shrink the time it takes to get from a concept to a first commit. They work right alongside developers, speeding up some of the most tedious tasks.
AI assistants can help you:
- Automate Boilerplate Code: Instantly spin up the repetitive, foundational code for new components or functions. This frees up developers to focus on the actual logic.
- Generate Unit Tests: Quickly create solid test suites for new code, which means quality is baked in from the start and the whole testing process moves faster.
- Suggest Refactors and Fixes: Spot opportunities to clean up code, fix bugs, and improve performance as you type, cutting down on rework later.
By handing off these tasks to an AI partner, developers can spend their brainpower on high-level problem-solving. This not only shortens that initial coding phase but also improves the quality of the code that goes into review, making the entire process faster from start to finish.
Visualize and Improve Cycle Time with AI Insights
Knowing your cycle time is one thing. Actually doing something about it? That’s a whole different ballgame. Trying to piece together data from Git, Jira, and deployment logs is a painful, manual process that usually just tells you what went wrong last week.
This is where modern, AI-powered platforms come in. They connect the dots between theory and practice, turning all that raw data into an engine for real-time improvement.
These tools plug right into a developer’s main workspace, like VS Code or Cursor. By simply observing the coding workflow, they automatically capture the exact start and end of a task’s cycle time. No manual entry, no guesswork. This gives you a rock-solid, consistent baseline for what your team’s real velocity looks like.
From Raw Data to Actionable Insights
The magic of these platforms isn’t just collecting data—it’s how they present it. Forget about staring at a spreadsheet full of timestamps. You get interactive dashboards that show you precisely where every minute and hour is going.
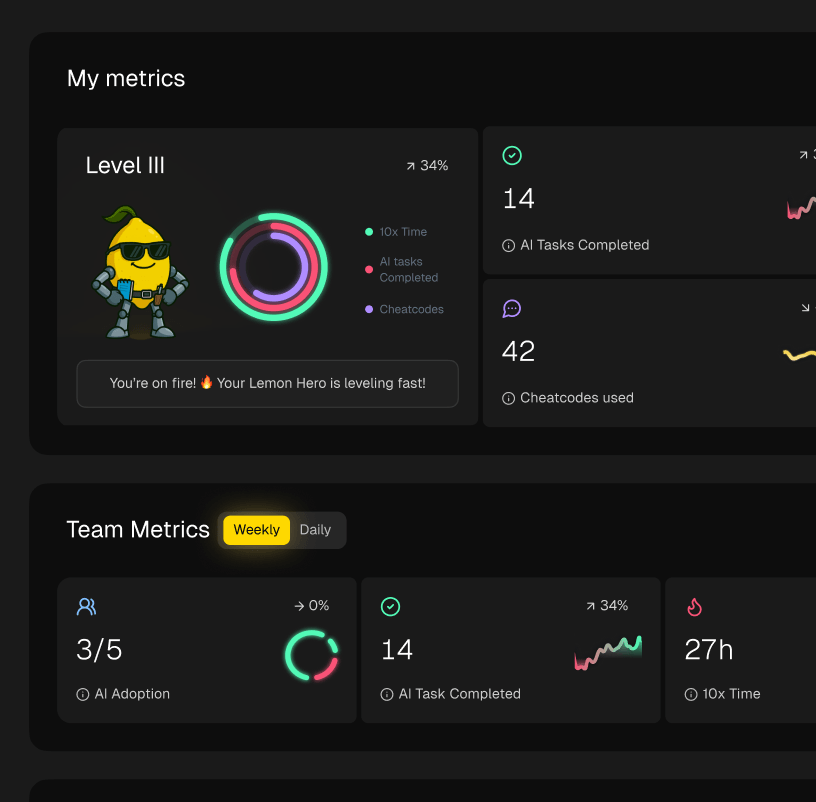
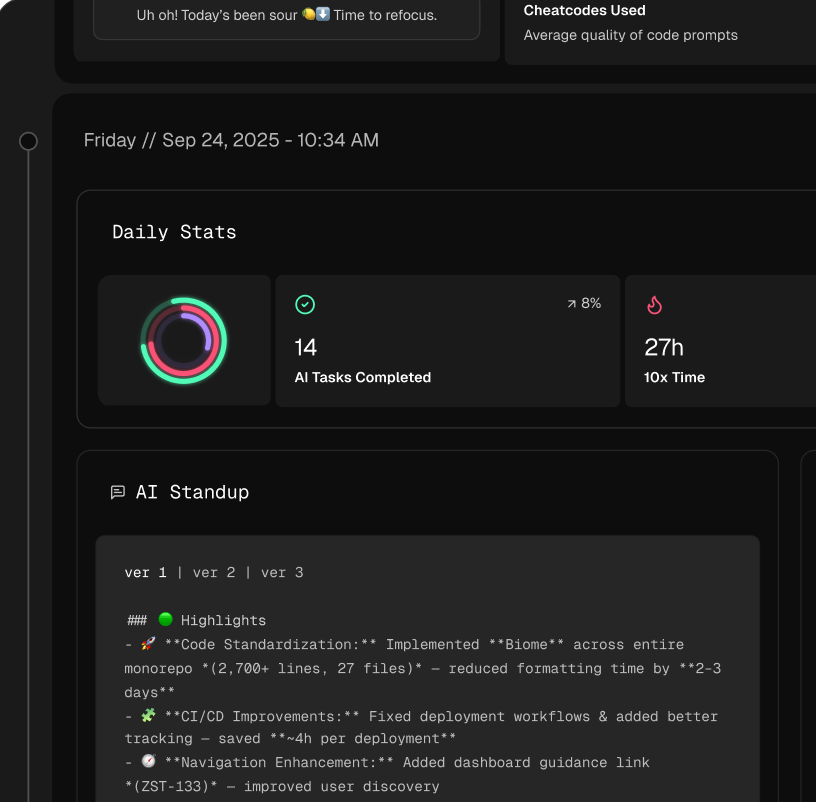
Suddenly, the abstract idea of cycle time becomes a clear, visual story of your development process. This is what it looks like in Zest, where individual work cycles are mapped out to expose bottlenecks at a glance.
By breaking down each cycle into its core phases—coding, review, deployment—teams can immediately see if pull request reviews are dragging on or if features are getting stuck in deployment queues.
This kind of visibility is a game-changer. It lets your team move from guessing to knowing. You can spot trends over time, compare the cycle times for bug fixes versus new features, and pinpoint the exact parts of your process that need a tune-up. It gives you the hard data needed to have productive, fact-based conversations about getting better.
Uncovering Hidden Friction with AI-Centric Metrics
Beyond just tracking the big phases, AI-powered tools add a completely new layer of analysis. They can identify moments of “developer friction”—those little struggles within a coding session that quietly inflate your cycle time.
Think of these tools as a proactive partner, not just a passive tracker. They can flag when a developer got stuck, spent way too long refactoring a simple function, or wrestled with a confusing API. All of these moments add up.
This shifts the focus from just measuring how long the coding phase took to understanding its quality and efficiency. When you can see these specific moments of struggle, you can find opportunities for better documentation, targeted training, or small process tweaks that make a huge difference. To learn more, check out our guide on the new era of AI software engineering, which explores how these insights are reshaping development.
Ultimately, these tools help your team:
- Automate Measurement: Stop wasting time manually tracking cycle time.
- Visualize Bottlenecks: Instantly see where work is getting jammed up.
- Identify Friction: Pinpoint the exact moments of struggle that slow developers down.
- Shorten Feedback Loops: Use real-time data to make immediate improvements.
By bringing an AI-powered approach to your workflow, your team can finally get a clear picture of the entire development process and take smart, targeted actions to ship value faster and more predictably.
A Few Common Questions About Cycle Time
Once teams start tracking cycle time, a few practical questions always pop up. Let’s tackle some of the most common ones I hear from engineering leaders and developers.
What Is a Good Cycle Time for a Software Team?
Everyone wants a magic number, but the honest answer is: it depends. A “good” cycle time is completely relative to your industry, how complex your tech is, and where your team is on its journey.
That said, the DORA metrics provide a helpful North Star. They found that elite teams often ship changes in less than 24 hours.
But don’t get hung up on that number. The best approach is to figure out your team’s baseline first. Measure where you are right now, and then focus on making small, steady improvements. The real win isn’t hitting some arbitrary target; it’s seeing that number consistently trend downward over time.
How Does Code Review Time Affect Cycle Time?
Massively. The code review stage is often the single biggest time sink in the entire development process. That period between a pull request (PR) being opened and finally getting merged can stretch on for days, acting like a giant brake on your momentum.
What causes this slowdown? It usually comes down to a few culprits:
- Long Review Queues: PRs just sit there, piling up and waiting for a reviewer to become available.
- Massive PRs: Huge, complicated pull requests are intimidating. Nobody wants to review them, so they get pushed off, again and again.
- Vague Expectations: If there are no clear team agreements on how quickly PRs should be reviewed, they can languish in limbo indefinitely.
If you want to shorten your cycle time, start here. Focusing on smaller PRs and setting clear expectations for review speed are two of the most powerful changes you can make.
Can Cycle Time Be Gamed or Misused?
Oh, absolutely. And it’s a quick way to destroy team morale. Like any metric, if you use it the wrong way, it will backfire.
Warning: Never use cycle time to judge individual developers. If you turn it into a competition or a performance management tool, you’ll just incentivize people to ship sloppy code or slice work into tiny, meaningless chunks to look good on a dashboard.
Cycle time is a diagnostic tool for your system, not a report card for your people. It’s meant to be owned by the team to help everyone spot bottlenecks in the way you work together. The goal is to improve the process, not to point fingers.
Ready to stop guessing and start seeing? Zest automatically captures your team’s cycle time and other critical AI-assisted workflow metrics directly from VS Code and Cursor. Visualize your process, pinpoint bottlenecks, and get the insights you need to ship faster. Start for free and turn your data into action at https://meetzest.com.
Master Your Cycle Time
Turn measurement into a diagnostic tool for your entire engineering process, not a report card for your people.
📊 Core Metrics
- Average Cycle Time — The mean elapsed time from first commit to deployment for all tasks in a period.
- Cycle Time Trend — The week-over-week or month-over-month change in your team's average cycle time.
- Code Review Velocity — The average time a pull request waits in the "review" phase before being merged.
🕹️ My Cheatcodes
- 🌱 System, Not Person — Use cycle time to diagnose the health of your process, never to judge individual performance.
- 🦎 Trend Over Target — Focus on achieving a consistent downward trend rather than chasing an arbitrary industry number.
- ⚡ Shrink the Batch — Recognize that smaller pull requests are the single biggest lever for reducing review time and overall cycle time.
✅ Before Optimizing
- 🔍 Establish a clear, consistent baseline for your team's current cycle time.
- 📊 Identify the longest "waiting" phase in your current process (e.g., code review).
- 🧭 Set team agreements on PR size and expected review turnaround times.
- 📈 Track your average cycle time trend, not just individual task times.
Gallery
Lemon shots