
Velocity Tracking Agile: velocity tracking agile to boost sprint predictability
In agile development, velocity tracking is all about measuring how much work your team can realistically get done in a single sprint. We typically measure this in story points.
Think of it less as a report card on productivity and more as a powerful tool for forecasting. By looking at the average work completed over the last few sprints, teams get a reliable number they can use to predict future timelines and make commitments they can actually keep.
What Is Velocity and Why Does It Matter
Picture your development team as a high-performance engine. You wouldn’t gauge its health by constantly pushing it to the redline, right? You’d look at its consistent, sustainable output. That’s exactly what velocity tracking in agile does. It’s not about how fast the team can sprint in a short burst; it’s about the predictable pace they can maintain for the long haul.
This simple metric changes planning from hopeful guesswork into a conversation backed by real data.
At its heart, velocity answers the million-dollar question in project management: “When will it be done?” Instead of relying on gut feelings, you can use a straightforward calculation. If your backlog has 100 story points left and your team consistently knocks out 20 points per sprint, you can forecast with confidence that it’ll take about five more sprints to finish.
The Three Pillars of Velocity Tracking
Getting a handle on your team’s velocity brings huge benefits that improve how you plan, communicate, and deliver. It’s all about creating a system built on predictability and trust.
-
Accurate Sprint Commitments: Looking at past velocity data is the best way to stop overcommitting. If a team knows it averages 25 story points, they won’t feel pressured to take on a 40-point sprint. This means fewer failed sprints, less burnout, and a team that feels successful.
-
Reliable Long-Term Roadmapping: Velocity gives product managers and stakeholders a realistic glimpse into the future. It makes credible long-term planning possible, so you can set launch dates and sync up with marketing efforts without crossing your fingers.
-
Fostering Honest Conversations: A stable velocity chart is your source of truth. When stakeholders ask for more features faster, the conversation can shift from “we can’t” to “we can, and here’s what the data tells us it will take.” It turns a high-pressure demand into a practical discussion about trade-offs.
Ultimately, velocity is like a mirror reflecting the health of your team’s process. A sudden drop could signal a hidden roadblock, while a steady, predictable trend points to a healthy, sustainable workflow.
Understanding why velocity matters is the first step. The next is figuring out how to improve it. For some great starting points, check out these proven strategies to improve developer productivity. Focusing on a sustainable pace is how you truly transform your planning process.
How to Accurately Measure Your Team Velocity
Figuring out your team’s velocity is pretty simple on the surface, but doing it right requires discipline. At its core, the formula is just the sum of story points for all user stories your team fully completes in a sprint. If you knock out stories estimated at 5, 8, and 3 points, your velocity for that sprint is 16.
But here’s the catch: relying on a single sprint’s number is like trying to guess the weather for the whole year based on one sunny Tuesday. It just doesn’t work. Every sprint has its own quirks—holidays, surprise bugs, or a task that turns out to be a monster. A single data point is noisy and makes for a terrible baseline.
This is exactly why the rolling average is your secret weapon for accurate velocity tracking.
Why a Rolling Average Is Your Best Friend
A rolling average smooths out the natural ups and downs of each sprint, giving you a much more stable and realistic number to work with for future planning. Most experienced agile teams look at the average of their last three to five sprints. This gives you a metric that truly reflects your team’s sustainable, predictable pace, not just a one-off performance.
To see this in action, let’s look at how a team’s velocity can fluctuate and how a rolling average provides a clearer picture.
Calculating a 3-Sprint Rolling Average Velocity
This table demonstrates how a rolling average smooths out sprint-to-sprint variations to provide a more reliable velocity metric for future planning.
| Sprint Number | Completed Story Points | 3-Sprint Rolling Average |
|---|---|---|
| Sprint 1 | 25 Points | N/A |
| Sprint 2 | 18 Points | N/A |
| Sprint 3 | 23 Points | 22.0 Points |
| Sprint 4 | 28 Points | 23.0 Points |
| Sprint 5 | 21 Points | 24.0 Points |
As you can see, even though Sprint 5’s output was only 21 points, the team’s stable, predictable velocity is actually closer to 24. That’s the number you should use for planning your next sprint, not the 21 from the most recent one.
The Non-Negotiable Rule of “Done”
None of this works—not the simple calculation, not the rolling average—without a crystal-clear, universally accepted Definition of Done (DoD). This is, without a doubt, the single most important factor in measuring velocity correctly.
Your Definition of Done is a formal agreement with the team on the criteria that a user story must meet before it can be considered complete. If a story is “99% done,” it contributes zero points to your velocity.
This rule has to be strict because velocity should only ever measure fully shippable value. If teams start counting partially finished work, the numbers get inflated, creating a false sense of progress that almost always leads to broken promises and missed deadlines.
When you get this right, the benefits are huge. It’s the foundation for reliable forecasting, roadmapping, and making commitments you can actually keep.
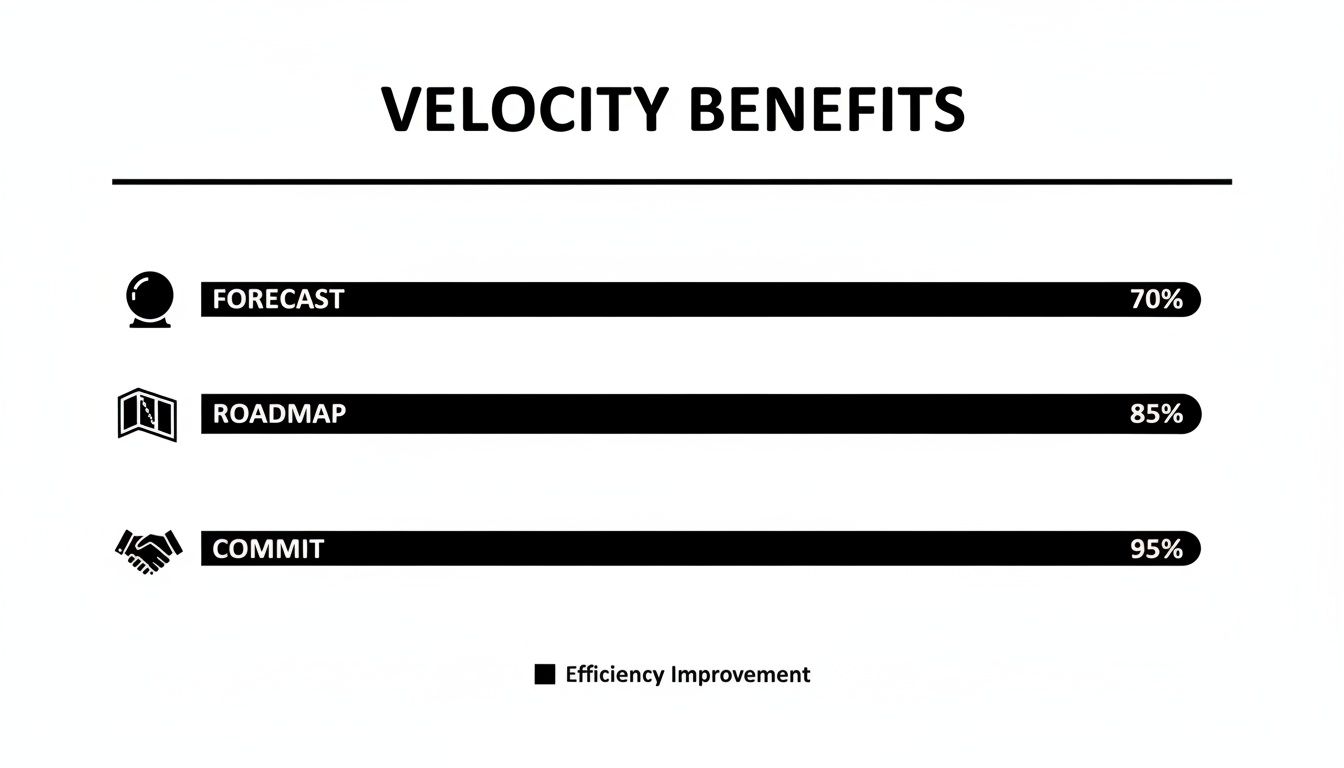
This structured approach pays off in a big way. Some studies have found that teams implementing proper velocity tracking see a 40% improvement in their estimation accuracy. Before they had a reliable baseline, scope creep and blown deadlines were just part of the job. You can discover more insights about these Agile findings to see just how much data-driven planning can change the game. Ultimately, it’s about building trust and delivering on your promises, sprint after sprint.
Reading the Story in Your Velocity Chart

Your velocity chart is much more than a bunch of bars on a graph. It’s a story about your team’s workflow, its challenges, and its wins. When you learn to read that story, velocity tracking agile stops being a reporting chore and becomes a powerful way to understand what’s really going on.
The patterns you see are like breadcrumbs leading you straight to the most important conversations for your next retrospective. A chart that bounces around isn’t a sign of failure—it’s a conversation starter, pointing you to exactly where you need to focus.
Decoding Common Velocity Patterns
To get the most out of your velocity chart, you have to look past the numbers and understand what’s causing the shapes you see. Every line, every spike, is a clue about your team’s health and how smoothly things are running.
Here are a few common patterns you’ll run into:
- A Stable, Predictable Line: This is what you’re aiming for. A relatively flat line means your team has hit a sustainable rhythm. They have a good handle on their capacity, their estimates are on point, and they deliver consistently. This is the bedrock of reliable forecasting.
- A Steady Upward Trend: This is a clear sign of a team that’s growing and getting better. It suggests they’re really starting to click, getting the hang of new tech, or successfully knocking down roadblocks sprint after sprint. It’s solid proof that your retrospectives are actually working.
- Erratic Jumps and Dips: A highly volatile chart is the one you need to investigate immediately. A sudden spike might mean the work was easier than expected, but a sharp drop almost always signals a hidden problem. This is your cue to start asking questions.
Using Velocity as a Diagnostic Tool
When you see that volatility, the question isn’t what, it’s why. The chart itself won’t give you the answer, but it points you exactly where to look. An unstable velocity is often just a symptom of deeper issues that can tank your projects if you ignore them.
A volatile velocity chart isn’t an indictment of the team; it’s an invitation to a more honest conversation. It highlights systemic friction points like technical debt, constant interruptions, or impending burnout before they become crises.
For instance, historical data shows that new teams often face over 50% variation in their output. This usually comes from fuzzy definitions of “done” or blockers that never get tracked. In contrast, top-performing teams who monitor their progress closely can hit 85-95% accuracy on their sprint commitments.
Ultimately, reading your velocity chart is about connecting data to real human experiences. It helps you understand not just what your team is delivering, but how they’re delivering it. This mindset is similar to how educators track learner progress with practical metrics and data-driven insights to foster continuous improvement.
By focusing on the story behind the numbers, you turn a simple metric into a powerful tool for building a healthier, more predictable team. For a closer look at other key metrics, check out our guide on developer productivity metrics.
Best Practices for Healthy Velocity Tracking
Velocity is an incredibly powerful forecasting tool, but like any tool, it’s all in how you use it. When you get it right, tracking velocity builds trust, makes your team more predictable, and fuels a culture of getting better together. But when it’s misused, it can turn toxic fast, killing psychological safety and pushing people to focus on all the wrong things.
A healthy approach means treating velocity as a diagnostic tool for the team, not a report card for management. The real goal isn’t to chase a bigger number—it’s to create a sustainable, predictable rhythm for getting work done.
Stabilize Your Metrics for Reliable Forecasting
The key to healthy velocity tracking is consistency. A single sprint’s data point is just noise; it doesn’t tell you much because of natural ups and downs. To get a real feel for your team’s sustainable pace, you have to smooth out those fluctuations.
The best way to do this is by using a rolling average over three to five sprints. This gives you a much more stable and reliable number to plan against. The data backs this up, too—rolling averages can improve forecasting by up to 50%. One study of 500 Agile teams found that a three-sprint average helped stable teams slash their planning errors by 35%, while a five-sprint average worked better for teams with more volatility. To see more on how data-driven approaches are changing development, you can explore the findings on Agile velocity.
For this to work, a couple of other things need to stay consistent:
- Keep Sprint Lengths Uniform: If you jump between one-week and two-week sprints, you can’t compare your historical data. It’s apples and oranges.
- Maintain a Stable Team: Every time someone joins or leaves the team, your velocity essentially resets. The new group will need a few sprints to find its own new, reliable baseline.
Use Velocity as a Planning Tool, Not a Weapon
This is the most important rule of all, and it’s all about mindset. Velocity should never, ever be used to compare teams or measure how “productive” individuals are. Every team’s story points are unique to them, so comparing Team A’s velocity to Team B’s is not only meaningless—it’s destructive to morale.
Instead, think of velocity as your guide for building a smart planning buffer. Once you have a stable average, don’t jam your sprint backlog with 100% of that number.
A healthy planning buffer is a 10-20% cushion for the unknown. If your team’s average velocity is 30 points, try committing to just 24-27 points. This leaves room for unexpected problems, paying down tech debt, and helping each other out. The result? More realistic commitments and way less stress at the end of the sprint.
This simple practice turns velocity from a source of pressure into a source of empowerment. It gives the team the breathing room they need to maintain quality and handle surprises without feeling like the whole sprint is going off the rails. Understanding these nuances is a core part of building a strong, agile process, which we cover in our guide to agile development best practices. By focusing on predictability instead of just raw output, you create an environment where teams can thrive and deliver great work, sprint after sprint.
Common Velocity Mistakes That Wreck Team Trust
Velocity is a fantastic tool for forecasting—when it stays with the team. The moment it gets co-opted as a management weapon, it turns toxic. When leadership focuses on the number instead of the story behind it, trust evaporates, and the entire agile process begins to crumble.
These mistakes turn a helpful diagnostic tool into a source of fear and anxiety. They push teams to game the system rather than deliver real value. If you want to build a healthy, high-performing engineering culture, avoiding them is non-negotiable.
Treating Velocity as a Productivity Score
This is the single most destructive mistake you can make. Velocity measures a team’s capacity for complexity, not their effort or speed. When managers start praising teams for a high number or grilling them when it dips, the dynamic immediately sours.
Developers are smart. They quickly learn to optimize for the metric. They might inflate story point estimates, split stories into smaller (but less valuable) chunks, or—worst of all—cut corners on quality to cram more “points” into a sprint. This behavior racks up technical debt and leads to burnout, all while painting a completely false picture of progress.
Comparing One Team Against Another
Trying to compare the velocity of Team A to Team B is fundamentally flawed. It’s totally meaningless. Story points are a relative estimation tool, and each team’s context is unique. A “5-point” story for Team A could be wildly different in complexity from a “5-point” story for Team B. Their skills, product area, and even how they feel about a “5” are completely different.
Using velocity for cross-team comparison is like comparing the speed of a car in miles per hour to a boat in knots without any conversion. It just doesn’t work. All it does is foster unhealthy competition, kill collaboration, and encourage teams to inflate their numbers just to look good.
Pressuring Teams to Constantly Increase Velocity
A rising velocity isn’t automatically a good thing. Pushing teams to make the number go “up and to the right” is a recipe for disaster. The real goal is a sustainable, predictable velocity, not breakneck speed. A stable velocity means the team can forecast reliably, which is far more valuable to the business than a number that’s always climbing.
Constant pressure to increase the number forces teams into unsustainable habits. They’ll skip crucial non-feature work like refactoring, paying down technical debt, or investing in better tooling. Sure, you might get a short-term velocity boost, but it inevitably leads to a long-term collapse in both quality and morale.
At the end of the day, velocity must remain a tool owned by the team. It’s there to help them plan their work and improve their own process. Once it leaves that circle of trust, it stops being helpful and starts causing real damage.
Give Your Velocity Tracking an Upgrade with AI

Traditional agile velocity tracking is great at showing you what happened in a sprint. You get a number, and that’s about it. But what if you could understand why it happened? That’s where AI-powered tools come in.
Instead of just giving you a historical metric, modern AI platforms enrich your velocity data with real-time context. This turns velocity from a lagging indicator—something you look back on—into a proactive tool you can use to make adjustments during the sprint.
From Looking Backwards to Acting Now
Imagine not having to wait for the retrospective to figure out why a sprint felt sluggish. AI can analyze your team’s development workflow as it unfolds, automatically flagging the hidden friction that throws your velocity off course.
These tools connect the dots between what’s happening in the code and what the team is actually shipping, uncovering patterns a human might easily miss.
Think about what this could surface:
- Hidden Bottlenecks: Is there a specific file or process where developers consistently get stuck? AI can pinpoint exactly where people are losing time.
- Automated Blocker Reports: Instead of relying on memory, AI can automatically summarize the real obstacles and wins for your daily stand-ups, making sure blockers get addressed right away.
- Real-Time Help: Some systems can even detect when a developer is struggling with a complex task and offer contextual hints or suggest reusable code to get them unstuck.
By turning historical data into in-the-moment guidance, AI helps teams stabilize their workflow during a sprint, not just analyze it afterward. This proactive stance is a game-changer for maintaining a predictable pace.
This shift helps your team focus on making small, continuous improvements every day. For more ideas on building this kind of proactive environment, check out our guide on improving productivity for developers.
Ultimately, bringing AI into the picture empowers teams to do more than just track their velocity. It helps them actively manage and improve it, leading to faster, more consistent delivery cycles.
Supercharge Your Velocity Tracking
Use AI insights to transform retrospective data into proactive, in-the-moment workflow improvements.
📊 Key Metrics to Watch
- Time to Unblock — How long does a developer stay stuck before an AI hint or team support gets them moving again?
- Proactive Adjustments — How many course corrections did you make mid-sprint based on real-time bottleneck alerts?
- Velocity Stability Score — A measure of how consistent your velocity is from one sprint to the next, which should improve with proactive problem-solving.
🕹️ My Cheat Codes
- 🌱 Ask ‘Why’ — Use AI to see the story behind your velocity numbers. Why did we slow down? Why did we speed up?
- ⚡ Act Now — Don’t wait for the retrospective. When AI flags a blocker, tackle it during the sprint.
- 🧭 Automate Stand-up Prep — Let the AI summarize the real wins and roadblocks. It keeps everyone aligned and focused.
📈 Questions to Ask Yourself
- 💡 Are we only looking at our velocity after the sprint is already over?
- 🧩 What invisible roadblocks could be slowing down our team right now?
- 📘 How can we use AI to help our developers get unstuck faster?
Even after you get the hang of tracking velocity, some tricky situations are bound to pop up. Let’s tackle a few of the most common questions that teams run into.
What Should We Do If Our Velocity Is Zero?
First, don’t panic. A sprint with zero velocity feels like a gut punch, but it’s really just a loud and clear signal that something needs attention. It means that nothing the team worked on was fully completed and met your “Definition of Done.”
The most important thing to do is treat it as a goldmine of information for your next retrospective. Dig in and ask the tough questions. Were the stories just too big to finish in one sprint? Did an unexpected roadblock derail everything? Were we waiting on another team for too long? Use the answers to get better at breaking down work, planning for risks, and clearing blockers next time around.
How Do Team Changes Affect Velocity?
Anytime someone joins or leaves the team, you have to hit the reset button on your velocity. Your old data just isn’t a reliable predictor anymore. Think about it—the entire team dynamic has changed, and so has its capacity.
A new or reconfigured team needs a little time to find its groove. It usually takes about two or three sprints for them to establish a new, stable baseline velocity. Once you have that, you can start using the new average for forecasting again. Whatever you do, don’t try to guess or just carry over the old numbers; let the new team set its own pace.
Does Kanban Use Velocity Tracking?
Great question, but no. Velocity is a metric built for Scrum and other agile methods that work in fixed-length iterations, or sprints. Kanban is all about continuous flow, so it uses a different set of metrics to track performance and predictability.
Instead of velocity, Kanban teams lean on “flow metrics.” The two most important ones are:
- Cycle Time: This tells you how long it takes for a single task to go from “In Progress” to “Done.”
- Throughput: This is simply the number of work items your team completes in a given time period, like a week or a month.
These metrics help you forecast just like velocity does, but they’re designed specifically for a flow-based system, not a time-boxed one.
Ready to move beyond just tracking velocity and start understanding the why behind your numbers? Zest is an AI coding workflow manager that provides real-time insights to help your team spot bottlenecks, share effective strategies, and ship faster. Turn your development data into proactive improvements. Learn more at Zest
Master Agile Velocity Tracking
Turn your velocity data into a powerful tool for predictable forecasting and sustainable team health.
📊 Core Metrics
- Rolling Average Velocity — The average story points completed over the last 3-5 sprints for stable forecasting.
- Sprint Commitment Accuracy — The percentage of planned work successfully completed, reflecting planning realism.
- Velocity Volatility — The degree of fluctuation between sprints, used to spot hidden process issues.
🕹️ My Cheatcodes
- 🌱 Stabilize First — Always use a 3-5 sprint rolling average; never rely on a single sprint's data.
- 🛡️ Build a Buffer — Only commit to 80-90% of your average velocity to account for uncertainty and maintain quality.
- ⚖️ Never Compare Teams — Treat velocity as a team-specific metric for forecasting, not a tool for cross-team performance reviews.
✅ Before Your Next Sprint Plan
- 🔍 Confirm team composition and sprint length are consistent.
- 📊 Calculate your updated 3-5 sprint rolling average velocity.
- 🧭 Apply a 10-20% planning buffer to your average.
- 📈 Ensure the team's commitment is based on this buffered number.
Gallery
Lemon shots



