
A Guide to Velocity in Scrum for Agile Teams

In Scrum, velocity is simply the average amount of work a team finishes in a sprint. It’s measured in story points, but it’s not about speed. Think of it less like a speedometer and more like a reliable gauge of your team’s typical output.
It’s a historical average that helps you look forward, making it a powerful tool for planning and forecasting. The real goal here is consistency and predictability, not a mad dash to the finish line.
Understanding Velocity in Scrum

Let’s use an analogy. Imagine a team of artisan bakers who create custom cakes. Each cake is unique and requires a different level of effort. Instead of just counting the number of cakes they bake each week, they track the total “effort points” of all the cakes they fully complete. That’s exactly how velocity works in Scrum.
Velocity isn’t a measure of how fast a team works; it’s a measure of the volume of work they can sustainably deliver. It’s calculated by adding up the story points for all user stories that are 100% complete and meet the team’s agreed-upon Definition of Done.
The whole point of tracking velocity is to make planning more reliable. When a team knows its average output, it can confidently pull a realistic amount of work into the next sprint. This kind of self-awareness is empowering and helps create a sustainable pace, which is key to preventing burnout and keeping quality high.
For a quick reference, here’s a breakdown of the core concepts.
Scrum Velocity at a Glance
| Concept | Brief Explanation | Primary Purpose |
|---|---|---|
| What it is | A historical average of completed work (story points) per sprint. | To create a reliable baseline for future planning. |
| What it is not | A performance metric, a target, or a tool for comparing teams. | It’s not for judging speed or individual productivity. |
| How it’s calculated | Sum of story points for all fully completed stories in a sprint. | To measure finished, value-delivering work. |
| Why it matters | Enables data-driven forecasting and realistic sprint commitments. | To improve predictability and foster a sustainable pace. |
This table highlights that velocity is a tool for the team, by the team, meant to make their lives easier—not harder.
The True Purpose of Velocity
The real magic of velocity in scrum is its ability to create predictability. A stable velocity gives the team, the Product Owner, and all stakeholders a clear, data-driven way to forecast how much work they can realistically get done over time.
It’s crucial to remember that this metric is for the team’s eyes only. It should never be used by management to compare teams or judge individual performance. Its true functions are to:
- Improve Sprint Planning: It helps the team pull a realistic amount of work from the product backlog.
- Enable Forecasting: It allows for rough estimates of how many sprints a large feature or epic might take to complete.
- Foster Team Conversation: It sparks valuable discussions during retrospectives about what’s helping or hindering the team’s flow.
Velocity is a reflection of the past, not a promise for the future. Its power comes from showing a team what they typically accomplish, allowing them to make more informed decisions moving forward.
Fluctuations and Stabilization
For a new team or one going through changes (like adding or losing a member), velocity is going to bounce around. This is completely normal and expected. It usually takes anywhere from three to six sprints for a team’s velocity to start stabilizing as they get their sea legs and refine their processes.
In the world of Scrum, a team’s velocity is like its heartbeat. A 2023 Atlassian report noted that average velocities often hover around 25-35 points for a two-week sprint, with top-performing teams pushing 50+. Fluctuations are part of the journey, but tracking velocity sprint-over-sprint is fantastic for spotting hidden blockers.
Seeing how Scrum fits into the bigger picture of project management for software engineering helps put metrics like velocity into perspective. The goal isn’t to make the number go up forever; it’s to find a predictable rhythm the team can rely on.
How to Calculate and Track Your Team’s Velocity
So, how do you actually figure out your team’s velocity? It’s not as complicated as it might sound. At its heart, it’s just a simple look back at what your team truly finished.
The most important rule here is that we only count work that is 100% done. If a user story isn’t fully complete and doesn’t meet the team’s “Definition of Done,” its points don’t count. Period. This keeps the metric honest and tied to actual delivered value, not just effort.

The Basic Math
For any given sprint, the calculation is a piece of cake: just add up the story points for every user story the team completed.
Formula: Total Story Points of ‘Done’ Stories = Sprint Velocity
For this number to mean anything, though, you need two things: a stable team and a consistent Definition of Done. If your team members are constantly changing or the goalposts for what “done” means keep moving, your velocity will be all over the place and pretty much useless for planning.
Let’s run through a quick example. Imagine a team—we’ll call them the “Phoenix Team”—just wrapped up their third sprint.
- Sprint 1: The team got through stories worth a total of 20 story points.
- Sprint 2: They knocked out work totaling 25 story points.
- Sprint 3: This time, they completed 22 story points.
Each number is the velocity for that specific sprint. It’s a start, but a single data point doesn’t give you the full picture.
Finding a More Reliable Average
Looking at just one sprint can be misleading. Sometimes you have a great sprint where everything clicks, and other times you get bogged down by unexpected issues. To smooth out these highs and lows, the standard practice is to calculate an average over the last three to five sprints. This gives you a much more stable and trustworthy number for forecasting.
Let’s figure out the Phoenix Team’s average velocity using their last three sprints:
- Add up the points: 20 + 25 + 22 = 67 total points
- Divide by the number of sprints: 67 / 3 = 22.3 points
So, the team’s average velocity is 22.3. This is the number they can bring to their next Sprint Planning meeting to get a realistic idea of how much work they can take on. If you’re new to this, you can learn more about how to measure velocity and explore different methods.
The goal isn’t to hit the average on the dot every single time. Think of it more like a capacity guardrail—a helpful, data-backed suggestion that prevents the team from overcommitting and helps them find a sustainable rhythm.
Bringing Velocity to Life with Charts
Once you have data from a few sprints, putting it on a chart is a game-changer. A velocity chart is just a simple bar graph that shows the completed story points for each sprint over time.
This simple visual makes it incredibly easy to see what’s going on at a glance. You can start asking better questions:
- How much did we actually complete each sprint?
- What’s our average capacity looking like?
- Is our delivery becoming more predictable or less?
When you track velocity visually, you can have much richer conversations during retrospectives. A sudden dip might point to a blocker you need to resolve, while a steady climb could be a sign that a new process is working well—something worth celebrating! The chart turns abstract numbers into a story about your team’s progress.
Using Velocity for Predictable Sprint Planning
Once your team has a few sprints under its belt and a reliable average velocity, you’ve unlocked its real power. This historical data is what transforms sprint planning from a guessing game into a data-informed conversation. It’s how your team can finally commit to a sprint’s worth of work with genuine confidence.
Think of your average velocity as a capacity guardrail. It’s not a rigid wall, but a helpful, data-backed boundary that helps you steer clear of one of the biggest pitfalls in agile development: overcommitment. By sticking close to this number, teams can find a sustainable rhythm, cut down on stress, and avoid the burnout that always follows a string of failed sprints.
From Average to Actionable Commitment
Putting this into practice is surprisingly simple. Let’s say your team’s stable average velocity over the last three to five sprints is 30 story points. That’s your starting line for the next Sprint Planning meeting. The team can confidently look at the top of the product backlog and pull in work that adds up to about 30 points.
This isn’t a hard and fast rule, of course. It’s an educated starting point. Some sprints, you might pull in 28 points because a story looks tricky; other times, you might feel ambitious and go for 32. The important part is that you’re starting from a place of known capability, not wishful thinking.
Your team’s historical velocity isn’t a target to hit; it’s a compass that points toward a realistic and achievable sprint goal. It gives the team the data they need to say “no” or “not yet” and have it be a professional assessment, not an emotional reaction.
Using historical data to plan sprints just works. Teams that adopt this approach can slash overcommitment by up to 40%. While averaging the last three sprints is a common practice, many experienced scrum masters will tell you to plan for only 75-85% of that average. Why? Because meetings happen. Bugs pop up. People take sick days. That buffer is what keeps a team from constantly falling short by that all-too-common 20-30%.
Long-Term Forecasting with Velocity
Beyond just the next two weeks, velocity is incredibly handy for looking further down the road. It’s the best tool you have for answering those big questions from stakeholders, like, “So, when can we expect this new feature epic to be finished?”
The math is straightforward. If a big feature has been sized up at 120 story points, and your team’s average velocity is 30 points per sprint, you can forecast that it’ll take roughly four sprints to get it done.
- Total Epic Size: 120 Story Points
- Average Team Velocity: 30 Story Points / Sprint
- Forecasted Duration: 120 / 30 = 4 Sprints
Suddenly, a vague “sometime next quarter” becomes a tangible, data-backed projection. For a closer look at this whole process, check out our guide on Agile development and sprint planning.
Communicating Forecasts, Not Deadlines
This part is crucial. When you share these long-term outlooks, you have to frame them correctly. This is a forecast, not a promise signed in blood. The best way to manage everyone’s expectations is to talk in terms of a velocity range.
Instead of saying, “It will be done in four sprints,” try something more honest and agile:
“Looking at our past performance, our team’s velocity is usually somewhere between 25 and 35 points per sprint. For a 120-point epic like this one, that means it will likely take between four and five sprints. We’ll have a much clearer picture after we complete the first sprint.”
This approach acknowledges the inherent uncertainty in software development. It builds trust by being transparent and turns velocity into a tool for planning together, not a stick for hitting the team with later. It gives the business the predictability it craves while respecting the complex reality your team lives in every day.
How to Read Velocity Charts and Spot Key Trends
A velocity chart is so much more than a bunch of bars on a graph. It’s a visual story of your team’s journey, sprint by sprint. Learning to read that story is one of the most important skills a Scrum Master or team member can develop, because it helps you look past the raw numbers and start asking the right questions about your team’s process, health, and predictability.
The chart itself is simple: it plots the story points your team completes on the vertical axis against the sprints on the horizontal axis. Over time, you’ll start to see patterns emerge, and each one tells you something important about how your team is working. The goal isn’t to chase an ever-increasing line—it’s to understand the “why” behind the ups and downs.
For instance, here’s a simple forecast. If your team’s average velocity is 30 points and you have a 120-point backlog, you can project that the work will take about four sprints.
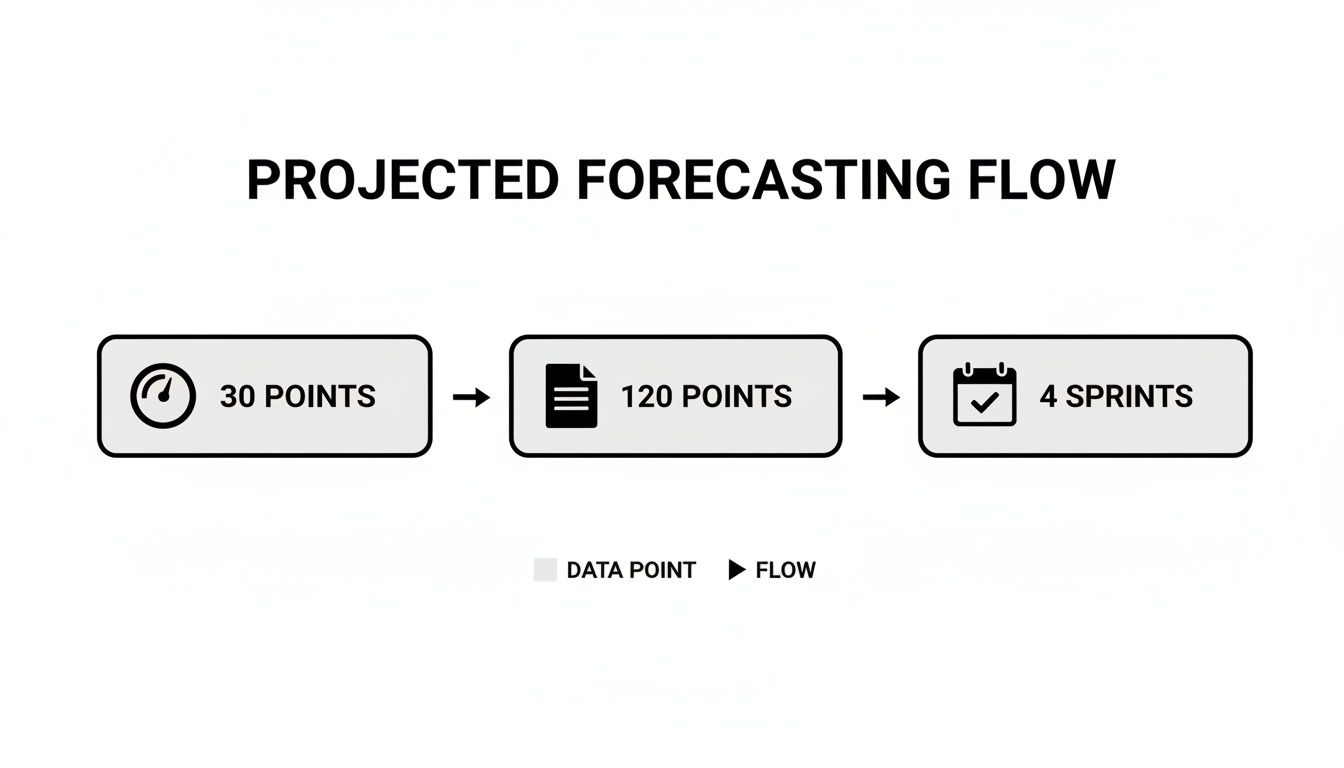
This is how velocity turns a big chunk of work into a realistic, time-based forecast.
Deciphering Common Chart Patterns
Every velocity chart tells a unique story. Once you learn to recognize the common plotlines, you can spot issues before they become major problems and celebrate the right kinds of wins. A team that truly understands its own patterns can have far more productive retrospectives.
Here are the key trends to watch for:
- 📈 The Steady Climb: Seeing a gradual, upward trend is usually a good sign. It often means the team is really starting to gel, your processes are getting smoother, or you’re getting better at breaking down and estimating work.
- 📉 The Slow Decline: A consistent downward trend is a major red flag. It could be a symptom of mounting technical debt, team burnout, or a steady stream of interruptions. It’s a clear signal to start digging for hidden roadblocks.
- 🎢 The Rollercoaster: An erratic chart with dramatic peaks and valleys screams instability. This pattern often points to inconsistent story sizing, vague requirements from stakeholders, or a team that’s constantly being pulled in different directions.
The real goal isn’t a number that just keeps going up. It’s a stable and predictable velocity that reflects a sustainable pace. Predictability is always more valuable than raw speed.
Using Trends to Spark Conversations
The real magic of a velocity chart is its power to start a conversation. When you spot a trend, you have a data point to bring to the team’s retrospective. This shifts the discussion from vague feelings (“I think last sprint was rough”) to concrete observations (“Our velocity dropped by 10 points last sprint, let’s talk about why”).
For example, a sudden nosedive in velocity is the perfect conversation starter. The team can dig into what really happened. Did a key person take a vacation? Did an unexpected production fire pull everyone off their planned work? Or did we get stuck waiting on another team for a week?
By treating velocity in scrum as a tool for learning, teams can get much better at forecasting. In fact, one study found that 60% of teams stabilize within 10% of their average velocity after just six two-week sprints. It shows just how quickly this metric can become reliable when you pay attention to it.
This kind of visual data is a critical piece of the ecosystem of agile development metrics that high-performing teams use to continuously improve. It’s not about passing judgment; it’s about building a shared understanding of how you work together.
Common Velocity Traps and Anti-Patterns to Avoid
Even for experienced teams, velocity can be one of the trickiest Agile metrics to get right. While it’s an incredibly helpful tool for a team to gauge its own capacity, it’s also one of the most misunderstood and misused. When people don’t understand what it’s for, velocity can quickly turn toxic, creating mistrust, encouraging teams to cut corners, and, ironically, slowing everyone down.
To use velocity effectively, you first have to understand the traps. Getting it wrong usually comes from a basic misunderstanding of what velocity actually is. It’s not a performance report or a measure of how “fast” a team is working. It’s simply a measurement of the average amount of work a team gets done during a sprint, which helps them forecast what they can do in the future. Anything else is asking for trouble.
Anti-Pattern 1: Comparing Velocity Between Teams
This is probably the single most common and destructive mistake managers make with velocity. Trying to compare Team A’s velocity to Team B’s is like comparing apples to oranges—it’s utterly pointless.
Why? Because story points are relative. Each team develops its own unique scale based on its members’ collective experience and understanding of the work. A task that a team of senior engineers estimates as a 5-point story might be a 13-point beast for a team of recent graduates. There’s no universal standard, so comparing the raw numbers tells you nothing about which team is more “productive.”
This practice doesn’t foster collaboration; it creates a toxic sense of competition. Teams feel pressured to inflate their story point estimates just to make their numbers look better on a chart. Once that happens, the data is corrupted, and any hope of accurate forecasting is gone.
The Fix: Forget about comparing teams to each other. Instead, focus on a single team’s trends over time. The right question isn’t, “Is Team A faster than Team B?” It should be, “Is Team A’s velocity becoming more stable and predictable?” A team with a predictable rhythm is a team you can build a reliable plan around.
Anti-Pattern 2: Using Velocity as a Performance Metric
The moment you tie velocity to performance reviews, you’ve turned a useful planning tool into a weapon. It’s no longer about forecasting—it becomes a target that people feel they must hit, no matter what.
This pressure inevitably leads to bad habits. Teams start looking for shortcuts, like skipping tests, ignoring their Definition of Done, or delivering low-quality work just to close more stories and pump up their numbers. It might look good for a sprint or two, but it creates a mountain of technical debt that will eventually bring the entire project to a grinding halt. You’re left with more bugs, a brittle codebase, and a completely burned-out team.
Remember, velocity measures output, not outcome. A team can have a sky-high velocity while building the wrong features or creating a technical mess that will haunt them for months.
Anti-Pattern 3: Pressuring Teams to Constantly Increase Velocity
A healthy team’s velocity will naturally go up and down. Expecting it to climb higher every single sprint is not only unrealistic but also completely counterproductive.
Sometimes a team needs to slow down to tackle technical debt or refactor a messy part of the codebase. Other times, a complex new feature introduces unforeseen challenges. These are normal, healthy parts of the development process that a relentless push for “more points” actively discourages.
The real goal of velocity in scrum isn’t to maximize the number—it’s to stabilize it. A predictable, consistent velocity is far more valuable for planning than a high but erratic one.
It’s crucial to spot these anti-patterns before they take root. The table below contrasts these common misuses with the healthier practices that align with true Agile principles.
Velocity Anti-Patterns vs. Healthy Practices
| Common Misuse (Anti-Pattern) | Why It’s Harmful | Correct Approach (Best Practice) |
|---|---|---|
| Comparing teams | Creates toxic competition and destroys the meaning of story points. | Focus on each team’s own trend toward predictability. |
| Judging performance | Encourages cutting corners, inflating estimates, and leads to burnout. | Use velocity for forecasting and capacity planning only. |
| Demanding constant increases | Discourages quality work, refactoring, and leads to an unsustainable pace. | Aim for a stable, predictable velocity that reflects a healthy rhythm. |
At the end of the day, velocity is a diagnostic tool meant for the team itself. It’s there to spark conversations during retrospectives and help the team make better commitments in sprint planning. When leaders protect velocity from these common abuses, it becomes a powerful ally in building a healthy and effective team.
Frequently Asked Questions About Velocity in Scrum
Let’s be honest, applying Scrum in the real world isn’t always straightforward. When it comes to velocity, teams run into the same tricky situations all the time. Here are some of the most common questions I hear, along with some straight answers to help you navigate them.
What Happens When a Team Member Is on Vacation?
This one’s simple: your team’s capacity goes down, so your velocity for that sprint will likely dip, too. And that’s completely fine. The last thing you want to do is try to “make up” for the missing person by pressuring everyone else to work harder.
During Sprint Planning, the team just needs to account for the reduced capacity. Think about it this way: if one person on a five-person team takes a week off during a two-week sprint, your team’s capacity is down by roughly 10%. So, it makes sense to plan for about 10% fewer story points. The resulting lower velocity isn’t a sign of a problem; it’s an accurate reflection of what the team could realistically accomplish.
Should We Count Story Points for Bugs and Spikes?
Ah, the classic debate. There’s no single “right” answer here, but there is one unbreakable rule: be consistent. An inconsistent approach is what turns velocity from a useful metric into a meaningless number.
Here are the two most common ways teams handle this:
- Point Everything: Some teams put story points on everything—bugs, chores, technical spikes, you name it. This method captures all the effort the team is putting in, giving a complete picture of where their time goes. The only catch is that it can blur the line between work that delivers new value and necessary maintenance, which might hide how much real product progress is being made.
- Point Only New Value: Other teams only assign points to user stories that deliver fresh, tangible value to the customer. Bugs and spikes are treated as the cost of doing business—they still get done during the sprint, but they don’t get points. This keeps your velocity metric laser-focused on feature output.
Just pick a lane and stay in it. Consistency is what makes your velocity a reliable forecasting tool.
How Long Does It Take for Velocity to Stabilize?
When a team is new or has just gone through a membership change, expect their velocity to be all over the place for a bit. This isn’t a red flag; it’s a totally normal part of the forming and storming process. They’re still figuring out how to work together, how to estimate as a group, and how to smooth out their workflow.
You can usually expect a team’s velocity to start stabilizing after about 3 to 6 sprints. This gives them enough time to work through the early kinks and find a predictable rhythm. A little patience goes a long way here.
Is a Higher Velocity Always the Main Goal?
Absolutely not. This is probably the biggest and most dangerous myth about velocity in scrum. The goal isn’t to get the biggest number possible; it’s to achieve a predictable and stable velocity.
Think about it: a team that consistently delivers 25 points every sprint is far more valuable for planning than a team that swings wildly between 15 and 45 points.
When you chase a higher number, you often see teams cutting corners on quality, blowing past their Definition of Done, and eventually burning out. A stable velocity, on the other hand, signals a healthy, sustainable pace. That’s what gives the business the reliable forecasts it needs to make smart decisions. Focus on consistency, not just speed.
Master Velocity in Scrum
Turn velocity into a powerful ally for planning, forecasting, and building a healthy, effective team.
📊 Core Metrics
- Average Velocity — The rolling average of story points completed over the last 3-6 sprints.
- Velocity Stability — The variance (%) from the average, aiming for consistency.
- Forecast Accuracy — The difference between predicted and actual sprints needed for epics.
🕹️ My Cheatcodes
- 🌱 Forecast, Don't Promise — Always communicate long-term estimates as a data-informed range, not a rigid deadline.
- 🦎 Guardrail, Not Target — Use velocity to guide sprint commitments, not as a performance goal to beat.
- ⚡ Protect the Metric — Never use velocity to compare teams or judge individual performance.
📈 Reflection Points
- 💡 Are we using our velocity to have better conversations in retrospectives and planning?
- 🧩 Do we feel pressure to make our velocity number look good for someone else?
- 📘 Is our team focused on achieving a stable, predictable velocity or just a higher number?
Gallery
Lemon shots



