
A Developer's Guide to velocity in agile development
Agile velocity is simply a measure of how much work a team gets done during a single sprint. It’s usually measured in story points or hours and gives you a sense of your team’s average output. Think of it as your team’s steady cruising speed, not a one-off burst of acceleration.
Understanding the True Meaning of Agile Velocity
Let’s use an analogy. Imagine your development team is on a long road trip. Velocity isn’t how fast the car is going at any given moment—it’s the average distance you reliably cover each day. This helps you realistically predict when you’ll reach your destination. In the world of agile, that destination is a finished project or a new feature release.
Velocity is figured out by looking back at past performance. You calculate it by averaging the story points completed over the last few sprints. For example, if your team knocked out 20, 25, and 23 story points in its last three sprints, your average velocity is 22.6. This number is an incredibly useful tool for planning and forecasting, not a stick to measure performance.
To give you a quick overview, here’s a simple breakdown of what velocity in agile is all about.
Velocity in Agile at a Glance
| Aspect | Description |
|---|---|
| What It Is | A measure of the amount of work a team completes per sprint. |
| How It’s Measured | Typically in story points or hours, averaged over several sprints. |
| Primary Purpose | To forecast future work and plan sprints realistically. |
| What It Isn’t | A productivity metric or a tool for comparing different teams. |
This table captures the essence of velocity, but its real value comes from knowing how to use it—and how not to use it.
What Velocity Is For
The main reason we track velocity in agile development is to make our work predictable. Once a team has a stable velocity, they can look at the product backlog and give a solid estimate of how many sprints it will take to get a chunk of work done. This builds trust with stakeholders and makes release planning much more strategic.
Here’s what velocity helps you do:
- Forecast Future Work: It gives you a data-backed way to estimate project timelines.
- Manage Expectations: It provides stakeholders with a clear, realistic picture of what the team can handle.
- Spot Process Issues: A sudden drop in velocity can be a red flag for a blocker, mounting technical debt, or some external dependency that needs to be addressed.
- Plan Sprint Commitments: It helps the team avoid biting off more than they can chew, ensuring they can work at a sustainable pace.
What Velocity Is Not
This is where things can go wrong. If you misunderstand what velocity is for, you can create a pretty toxic environment. It’s critical to know its limits and steer clear of the common mistakes.
Velocity is a planning tool, not a productivity weapon. When it’s used to compare teams or pressure developers for ‘more points,’ it loses all value and actively harms morale and quality.
Comparing the velocity of Team A (30 points) with Team B (50 points) is completely pointless. It’s like comparing the gas mileage of a sports car to a moving truck—they’re built for different things and operate on totally different scales. Every team estimates work in its own way, so their point systems are never comparable. This is a crucial reason why tracking velocity as a primary KPI for engineering teams demands a lot of context.
Industry data shows that tech firms, which lead global Agile adoption at 80%, complete projects 25% faster than with traditional methods. This success is partly thanks to metrics like velocity, but only when they’re used correctly. The focus should always be on a single team’s trend over time, not on hitting a specific number or outperforming another team.
Calculating and Tracking Your Team’s Velocity
Alright, let’s get down to brass tacks. Moving from the idea of velocity to actually using it is where the magic happens. To calculate your team’s velocity, you first need a consistent way to measure work. This isn’t just about counting tasks; it’s about having a solid foundation.
This foundation rests on two key pillars of agile: a rock-solid Definition of Done (DoD) and consistent story point estimation. If you don’t have these locked down, your velocity numbers will be all over the place—and frankly, pretty useless.
Think of your Definition of Done as the team’s shared promise for what “finished” actually means. It’s a simple checklist that might include things like “code reviewed,” “unit tests passed,” and “pushed to the staging server.” This way, when someone says a 5-point story is done, everyone knows exactly what that entails. No ambiguity, no surprises.
Consistent estimation is just as important. Whether your team is a fan of the Fibonacci sequence (1, 2, 3, 5, 8) or another method, what matters is that everyone agrees on what a “point” represents. It’s not about time; it’s about a mix of effort, complexity, and uncertainty.
The Initial Velocity Calculation
Once you’ve got your foundation sorted, figuring out your starting velocity is pretty simple. You just need to run a few sprints to get some data. Most teams find that three to four sprints is the sweet spot for establishing a reliable baseline.
The process is straightforward: at the end of each sprint, you add up the story points for all the user stories that were fully completed—meaning they met every single item on your Definition of Done.
Let’s look at a quick example:
- Sprint 1: The team knocks out stories worth a total of 15 points.
- Sprint 2: A great sprint! They completed stories totaling 20 points.
- Sprint 3: Things stabilized, and they finished 18 points worth of work.
To get your average velocity, you just do the math: add the points from those sprints (15 + 20 + 18 = 53) and divide by the number of sprints you measured (53 / 3). This gives you an initial velocity of about 17.6. From here, your team can plan to take on roughly 18 story points in the next sprint with a good deal of confidence.
If you want to dig a bit deeper into the numbers, check out our guide on how to measure velocity.
This visual really brings home how teams can use their established capacity to forecast sprints and build a reliable plan.
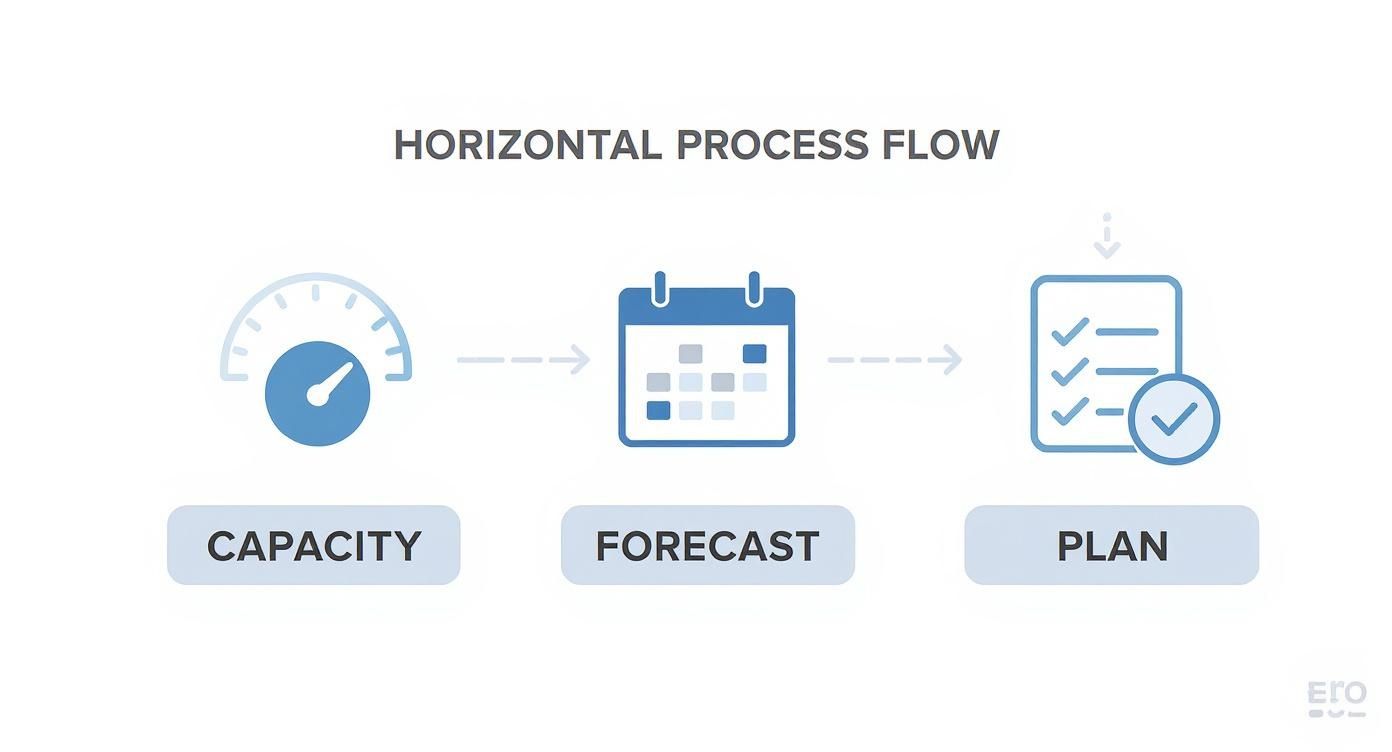
As the infographic shows, it’s a powerful feedback loop: you measure what you can do (capacity), use that data to look ahead (forecast), and build your sprint around that realistic prediction (plan).
Visualizing Velocity with Agile Tools
Sure, you could track all this on a spreadsheet, but why make life harder? Modern agile tools like Jira or Azure DevOps make tracking velocity a breeze. They generate charts that show you exactly how your team is progressing, helping you spot trends at a glance.
Two of the most helpful visuals are the Velocity Chart and the Burndown Chart. The Velocity Chart is your go-to for seeing how much work you planned to do in a sprint versus what you actually finished. It’s a simple bar graph, but it tells a powerful story.
A Velocity Chart is more than just a set of bars on a screen; it’s a window into your team’s rhythm. A stable or gently rising trend line is a great sign. It usually means you’ve got a healthy, maturing team that’s getting the hang of estimating and delivering work predictably.
In this Velocity Chart from Jira, you can clearly see the team’s commitment versus their completed work over several sprints.
See the two different colored bars? The gray ones show what the team planned to do, and the green ones show what they actually got done. This simple visual is gold for sprint retrospectives. It gives you a data-driven starting point to talk about why you might have over- or under-committed.
These conversations are what help you fine-tune your planning and estimation. Ultimately, a stable velocity is what leads to predictable, low-stress development cycles, and that’s a win for everyone.
Using Velocity for Predictable Forecasting
Once your team finds its rhythm and establishes a stable velocity, that number becomes so much more than a simple metric—it turns into your crystal ball for forecasting. This is where the magic happens. You stop looking backward at what you did and start confidently predicting what you can do. It’s how you finally answer that dreaded question from stakeholders, “So, when will it be done?” with data instead of a wild guess.
Let’s say your product backlog is sitting at a hefty 200 story points for a big upcoming release. If your team has been consistently knocking out an average of 20 points per sprint, the math is refreshingly simple.
Total Backlog Points / Average Velocity = Number of Sprints Needed
200 points / 20 points per sprint = 10 sprints
And just like that, you have a forecast grounded in reality. You can look your stakeholders in the eye and tell them that, based on the team’s proven track record, the release will likely take about 10 sprints to finish. This isn’t about setting a stressful, arbitrary deadline; it’s about building a predictable roadmap that everyone can trust.
From Timelines to Release Planning
This ability to forecast is a game-changer for release planning. Instead of crossing your fingers and hoping certain features make it by a specific date, velocity lets you map out what’s actually achievable.
Imagine a stakeholder needs a critical set of features, estimated at 60 story points, ready for a big trade show that’s four sprints away. With your stable velocity of 20, you know your team can realistically complete about 80 points (4 sprints x 20 points).
This means you can confidently commit to that 60-point feature set and still have a 20-point buffer for other important items. This kind of clarity is gold—it helps everyone make smart decisions about scope and priorities, which is the heart of effective agile development sprint planning.
One key study actually tracked engineering teams as they grew from 10 people in one office to 25 spread out across different locations. As you’d expect, their raw velocity dipped due to the added complexity. But by using their data, they got much better at prioritizing work and managing the backlog. It just goes to show that velocity in agile development is a powerful tool for the whole organization, not just a simple speed measurement.

A Practical Checklist for Developer Forecasting
Here’s a prompt + example response you can reuse as a checklist when confirming an Astro → Cloudflare Workers deploy is done right:
✅ Prompt
“Checklist: confirm my Astro site is deployed on Cloudflare Workers with best-in-class performance, SEO, and DX. Verify adapter, asset storage, caching, hydration, and SSR/SSG choices. Give me a clear yes/no on each item and point out fixes if something’s missing.”
📝 Example Response
Astro on Cloudflare Workers — Deployment Checklist
- Adapter → Using
@astrojs/cloudflareor@astrojs/cloudflare/worker? → ✅ Yes - Static vs SSR → Static pages prebuilt + only SSR where required (API, auth, etc.) → ✅ Yes
- Cold start avoidance → Worker bundle < 1MB, no heavy deps → ✅ Yes
- Assets → Offloaded to R2 / Cloudflare Images, not bundled in Worker → ❌ No → Fix: move images to R2 and rewrite URLs
- Caching → Edge cache headers set (
Cache-Control,stale-while-revalidate) → ✅ Yes - SEO → Title/meta tags verified, hreflang (if multilingual), robots.txt and sitemap.xml generated → ✅ Yes
- Core Web Vitals → Partial hydration configured, Lighthouse score >90 → ✅ Yes
- Global Edge → Tested from multiple PoPs (US/EU/Asia) for <100ms TTFB → ✅ Yes
- Limits → Worker within 30ms CPU budget, script <10MB → ✅ Yes
- Monitoring → Wrangler tail + Analytics enabled → ✅ Yes
Result: 9/10 checks passed. Only asset storage needs fixing.
Common Velocity Mistakes That Hurt Your Team
While velocity in agile development is an incredible tool for forecasting, it’s also one of the most misunderstood and misused metrics out there. When teams and managers fall into a few common traps, this helpful guide can quickly turn toxic. It leads to burnout, kills morale, and tanks code quality. Suddenly, it stops being a planning tool and becomes a weapon.
Spotting these anti-patterns is the first step toward a healthier, more productive engineering culture. Remember, the goal isn’t just to track points; it’s to create a sustainable and predictable workflow. Let’s break down the most destructive velocity mistakes and what your team should be doing instead.
Comparing Velocity Between Teams
This is probably the biggest and most damaging mistake you can make. A manager sees Team A hitting a velocity of 40 and Team B delivering 25, and the immediate conclusion is that Team A is “better” or “faster.” This completely misses the point of story points.
Why This Is a Terrible Idea: Every team’s estimation scale is their own. One team’s “5-point” story could easily be another team’s “8-point” task. These numbers are relative to the team doing the work, not some universal standard. Comparing them is like comparing apples to oranges—it’s meaningless and just encourages teams to inflate their estimates to look good on paper, which makes the metric useless.
The Right Way to Think About It: Focus only on a single team’s velocity trend over time. Is it staying consistent? Are you seeing wild swings from one sprint to the next? A stable velocity, regardless of the number, is the sign of a mature and predictable team. The whole conversation should be about predictability, not raw output.
Velocity in Agile is widely used for planning and forecasting, but industry experience shows it is often misinterpreted. A common pitfall is comparing velocities between teams—one team’s velocity of 40 story points per sprint might seem superior to another’s 25, but this ignores critical differences in estimation scales, team composition, and technical challenges. Find out more about common Agile velocity pitfalls on talent500.com.
Using Velocity as a Performance Metric
Another surefire way to create a toxic environment is to tie an individual’s performance review to the team’s velocity. As soon as you make velocity a target, you create all the wrong incentives and put crushing pressure on engineers to choose quantity over quality.
Why This Is a Terrible Idea: This approach punishes engineers for doing essential but “point-less” work. Things like mentoring a junior dev, refactoring messy code, or tracking down a tricky bug that doesn’t have a story attached to it. It turns a collaborative team sport into an individual race for points, which is the exact opposite of what Agile is all about.
The Right Way to Think About It: Judge individual performance on things that actually matter: contributions to team goals, code quality, collaboration, and mentorship. Velocity should stay where it belongs—as a team-level metric used for planning.
To help you tell the difference between healthy and unhealthy practices, here’s a quick-reference table.
Velocity Misuse vs Best Practice
| Common Mistake (Anti-Pattern) | Correct Approach (Best Practice) |
|---|---|
| Comparing velocity scores across different teams. | Analyzing a single team’s velocity trend over time. |
| Setting a target for velocity to increase each sprint. | Focusing on achieving a stable and predictable velocity. |
| Using velocity to measure individual developer productivity. | Treating velocity as a team-level planning and forecasting tool. |
| Ignoring dips in velocity and pressuring the team to “catch up.” | Using velocity fluctuations as a signal to investigate potential blockers. |
The key takeaway is that velocity is a diagnostic tool, not a performance whip.
Pushing to Increase Velocity Every Sprint
You’ve probably seen it before. A manager looks at a velocity chart and says, “We need to get this number up!” This mindset treats velocity like a measure of pure effort, assuming that a bigger number automatically means the team is working harder or better.
Why This Is a Terrible Idea: Constant pressure to inflate the numbers forces teams to cut corners. They’ll skip writing tests, let technical debt pile up, and churn out low-quality code that will absolutely slow them down later. It’s the classic “short-term gain, long-term pain” scenario.
The Right Way to Think About It: Think of velocity as a health indicator for your system. If it’s stable, your process is probably working pretty well. If you want to improve it, focus on removing obstacles. Streamline your CI/CD pipeline, pay down some technical debt, or spend more time refining your backlog. These actions improve the team’s flow and naturally lead to a healthier, more sustainable pace.
How to Improve Velocity the Right Way

Let’s get one thing straight: improving velocity in agile development is not about cracking a whip to make your team work faster or pull longer hours. That’s a one-way ticket to burnout, sloppy code, and a team that dreads coming to work. The right way to boost velocity is to work smarter by hunting down and eliminating the friction in your development process.
A stable or gradually increasing velocity is the sign of a healthy, mature team—not an exhausted one. Think of it like a pipeline. You don’t get more water through by cranking up the pressure; you find and fix the leaks and blockages. By focusing on sustainable improvements, you smooth out the workflow, and as a happy side effect, more valuable work gets done each sprint.
Strengthen Your Definition of Done
One of the biggest sources of friction is a weak or fuzzy Definition of Done (DoD). When every developer has a slightly different idea of what “done” means, you get a mess of confusion, inconsistent quality, and a pile of rework that brings everything to a crawl. A solid DoD acts as a non-negotiable quality checklist, making sure work doesn’t keep bouncing back.
To fix this, get your team to agree on a DoD that is crystal clear. It should include concrete criteria that every single story has to meet before it can be considered complete.
- Code is peer-reviewed: At least two pairs of eyes should vet every change.
- Unit and integration tests are passing: This is your first line of defense against new bugs.
- Documentation is updated: A small step that saves massive headaches down the road.
- Feature is deployed to a staging environment: So it can be properly tested by QA before it ever sees a customer.
Tightening up your DoD drastically cuts down on that “almost-done” work that clogs the pipeline and kills your velocity. It’s a simple change that makes your team’s output way more predictable.
Master Your Backlog Refinement
A messy, unprepared backlog is like trying to build IKEA furniture with instructions written in crayon. If your team starts a sprint with user stories that are vague or way too big, they’ll spend half their time chasing down answers instead of actually building software. That mid-sprint chaos is a total velocity killer.
The key is effective backlog refinement, which ensures stories are truly Ready before they even get considered for a sprint.
A well-refined user story is like a chef’s prepped ingredient box. Everything is measured, the recipe is clear, and they can just start cooking. A vague story is like telling them to “make dinner” from an empty fridge—half the battle is just figuring out what you need.
Make backlog refinement a regular team ritual. Get everyone together to discuss, estimate, and clarify upcoming work. The goal is simple: break down big, intimidating epics into small, bite-sized stories that can easily be finished in one sprint. When a developer pulls a task, they should know exactly what to do from the get-go.
Invest in Automation and Tooling
Every manual, repetitive task your team performs is a quiet drag on their velocity. Things like manual deployments, running tests by hand, or setting up dev environments from scratch are all prime candidates for automation. Investing in a solid CI/CD (Continuous Integration/Continuous Delivery) pipeline is one of the best things you can do to free up your team’s time.
Think about it this way: Team A spends 30-60 minutes on a manual deployment for every little change. Team B has an automated pipeline that does the same thing in 5 minutes with a single click. Over a two-week sprint, Team B gets hours of valuable development time back. They’re not working harder; they’re letting the robots handle the boring stuff so they can focus on what matters.
Actively Manage Technical Debt
Technical debt is the invisible anchor holding your team back. All those “quick and dirty” fixes that save a little time today will come back to bite you, making every new feature harder and slower to build. If you want to maintain a healthy pace, you can’t just ignore it.
Start treating technical debt like any other piece of work. Write stories for refactoring clunky code, upgrading old libraries, or improving your test coverage. Estimate them, prioritize them, and put them in the backlog. A good rule of thumb is to dedicate a small slice of every sprint—maybe 10-20% of your team’s capacity—to paying it down. It’s a direct investment in your team’s future speed.
Common Questions About Agile Velocity
As your team starts to get the hang of agile velocity, you’ll notice a few questions and debates start to surface. This is actually a great sign—it means people are thinking critically about how they work. Let’s walk through some of the most common questions and give you some practical, no-nonsense answers.
The point isn’t to lay down rigid rules, but to give you a clear perspective that keeps your team focused on what really matters: predictability and a sustainable pace.
What Is a Good Velocity for a New Team?
This is easily the most common question I hear, and the answer usually catches people off guard: there is no magic number. A new team asking for a “good” velocity is a bit like a new runner asking what their first marathon time “should” be. It’s just not the right question to ask yet.
For a team that’s just starting out, the goal isn’t to hit some arbitrary target like 30 or 40 points. The real focus should be on finding a consistent rhythm. For the first few sprints, expect the numbers to be a bit messy. The team is still figuring out how to estimate together and getting a feel for the complexity of the work.
The only “good” velocity—for any team, new or established—is a predictable one. I’d much rather plan around a team that reliably delivers 20 points than one that bounces between 15 and 40.
A new team should focus on these things first:
- Consistent Estimation: Everyone needs to get on the same page about what a “point” actually means in terms of effort and complexity.
- A Rock-Solid “Definition of Done”: “Done” has to mean the exact same thing for every single story, every single time.
- Spotting the Trend: After three or four sprints, just look at the average. That’s your baseline. It’s not good or bad—it’s just your starting data point.
Nail down that stability first. Once you have a predictable pace, then you can start looking for ways to improve.
Should Our Velocity Increase Every Sprint?
Here’s another popular myth: a great agile team’s velocity chart should always be climbing up and to the right. Not only is this idea totally unrealistic, but it can also be damaging. It creates pressure for the team to start inflating estimates just to make the numbers look good.
The truth is, a mature agile team’s velocity usually flattens out. They find a sustainable pace and stick with it. Some fluctuation is completely normal. A dip might happen because the team tackled a gnarly, low-point story that needed a ton of research. A spike might happen because they knocked out a bunch of small, well-defined tasks.
These little peaks and valleys aren’t failures; they’re valuable insights. They’re the perfect conversation starters for your sprint retrospectives.
- Why did velocity dip? “We spent half the sprint battling a third-party API. Next time, maybe we should create a ‘spike’ story to investigate that first.”
- Why did velocity jump? “Every story was perfectly broken down and ready. This shows how much good backlog refinement helps us.”
The goal is not to be constantly accelerating. It’s to find a comfortable cruising speed that the team can maintain without burning out.
How Do Bugs and Tech Debt Affect Velocity?
This is where things can get messy if you don’t have a clear approach. How do you account for all the work that isn’t a shiny new feature? Simple: treat bugs and technical debt just like any other work item.
They take up your team’s time and energy, so they need to be estimated and put on the backlog. When a bug pops up, write a story for it, estimate its size, and prioritize it with everything else. The same goes for tech debt. If you need to refactor a clunky module or upgrade a critical library, make it a story.
Here’s why this is so critical:
- It makes the cost of quality visible. When stakeholders see stories for bugs and tech debt in the sprint, they understand the true price of cutting corners. It’s a powerful way to justify spending time on improving code quality.
- It protects the team’s capacity. By estimating this work, you stop the team from getting buried under “shadow work” that’s invisible during sprint planning.
- It makes your forecasts more accurate. Your velocity starts to reflect all the effort your team is putting in, not just the feature work.
Ignoring this stuff doesn’t make it disappear. It just makes your velocity a useless metric for planning. Treat bugs and tech debt as first-class citizens in your backlog, and you’ll build a much more transparent and sustainable process.
Ready to move from tracking velocity to optimizing your entire development workflow? Zest is an AI coding workflow manager that helps you measure and improve how your team uses AI in VS Code and Cursor. It provides automatic summaries, AI metrics, and shareable cheatcodes to turn individual experiments into team-wide wins. Ship faster with Zest.
Gallery
Lemon shots



