A Guide to Velocity in Agile for Predictable Delivery

In the world of agile development, you’ll hear the term velocity thrown around a lot. So, what is it really? Simply put, velocity is the average amount of work a team gets done during a sprint, usually measured in story points.
It’s not about how fast a team is working. Instead, think of it as a measure of a team’s predictable rhythm. This rhythm is the key to realistic forecasting and building trust with stakeholders.
What Is Agile Velocity and Why It Matters

Let’s use an analogy. Imagine an agile team is like a baker who’s just opened a new shop. The first week, they aim to bake 40 loaves of bread a day but only manage to finish 38. So, their initial “velocity” is 38. The next day, an oven malfunctions, and they only bake 29. But after a few weeks of ironing out the kinks, they find they can reliably produce about 36 loaves every single day.
That number—36 loaves—is their stable velocity. It’s not a performance target they have to beat; it’s a dependable average that helps them predict how much bread they can bake next month. This lets them confidently take new orders without overpromising. Velocity in agile is the exact same concept: it’s a tool for forecasting, not a scoreboard for performance.
To help clarify this crucial distinction, here’s a quick summary of what velocity is and what it isn’t.
Velocity at a Glance
| Concept | What It Is | What It Is NOT |
|---|---|---|
| A Planning Tool | A way to forecast how much work the team can realistically take on in future sprints. | A performance metric to judge or compare teams. |
| A Measure of Capacity | An average of the work a specific team completes over time. | A measure of speed, efficiency, or individual productivity. |
| A Conversation Starter | A data point used to spark discussions about process improvements and impediments. | A hard commitment or a guarantee of future output. |
Understanding these differences is fundamental to using velocity correctly and avoiding common pitfalls.
The Core Purpose of Velocity
At its heart, velocity creates a feedback loop that helps teams get better at planning and estimating. By tracking what they actually finish sprint after sprint, they can make much more realistic commitments going forward. For a deeper dive into the frameworks where this matters most, check out this excellent guide to the Agile Product Development Process.
This historical data helps answer the big questions that stakeholders always have:
- How much can we expect to get done in the next sprint?
- When is this project or feature set likely to be finished?
- Is our delivery becoming more predictable over time?
Velocity is a conversation starter, not a final judgment. It reveals patterns in a team’s workflow, highlighting both successes and impediments that need addressing in retrospectives.
Think about a real Scrum team. They might complete 38 story points in their first sprint, but then unexpected bugs cause a drop to 29 in Sprint 2. They bounce back to 38 and then 39 points in the next two sprints.
Their four-sprint average is now 36 story points ((38 + 29 + 38 + 39) / 4). This rolling average becomes their North Star for planning future sprints, giving them a data-backed number to work with.
Calculating and Tracking Your Team’s Velocity

The good news is that calculating velocity is surprisingly simple. There’s no fancy algorithm, just one hard-and-fast rule: at the end of a sprint, you add up the story points for only the work that is 100% complete.
That means if a user story is almost done or just waiting on a final review, it counts as zero. This all-or-nothing approach is what gives velocity its power. It forces us to measure what was actually delivered, not just the effort we put in.
This rule keeps the data clean. Giving partial credit muddies the water and makes your forecasts unreliable. You’re measuring what your team has genuinely finished based on its own agreed-upon Definition of Done.
Establishing a Stable Baseline with a Rolling Average
One sprint’s velocity is just a single data point. Maybe the team ran into unexpected roadblocks, or maybe they had a uniquely productive week. To get a number you can actually use for planning, you need to find a rolling average.
Typically, you’ll look at the last 3-4 sprints and average them out. This simple step smooths out the inevitable highs and lows, giving you a much more realistic view of what your team can consistently accomplish.
Let’s walk through a quick example:
- Sprint 1 Completed: 25 Story Points
- Sprint 2 Completed: 20 Story Points (a tricky bug threw a wrench in the works)
- Sprint 3 Completed: 28 Story Points (everything clicked this time)
- Calculate the Average: (25 + 20 + 28) / 3 = 24.33
So, for the next sprint planning session, this team can confidently use 24 story points as their baseline. It’s a number grounded in reality, not a hopeful guess.
Where and How to Track Your Velocity
When it comes to tracking velocity in agile, consistency trumps everything else. Your team needs a single source of truth that everyone can access and trust.
The specific tool you use is far less important than your commitment to using it consistently. A simple spreadsheet used diligently beats a fancy, expensive platform that’s updated sporadically.
Most modern agile tools come with built-in velocity charts that handle the calculations for you.
- Jira: Automatically generates a velocity chart from the story points completed in your sprints.
- Azure DevOps: Provides similar reporting and analytics right inside its Boards feature.
- Simple Spreadsheet: If you’re just getting started, a spreadsheet works perfectly well. All you need are columns for the sprint, the completed points, and your rolling average.
Whatever tool you choose, two things must stay constant for the data to mean anything: how your team estimates story points and what your Definition of Done is. If those goalposts are always moving, your velocity metric will become erratic and lose all its predictive value.
Using Velocity for More Accurate Forecasting
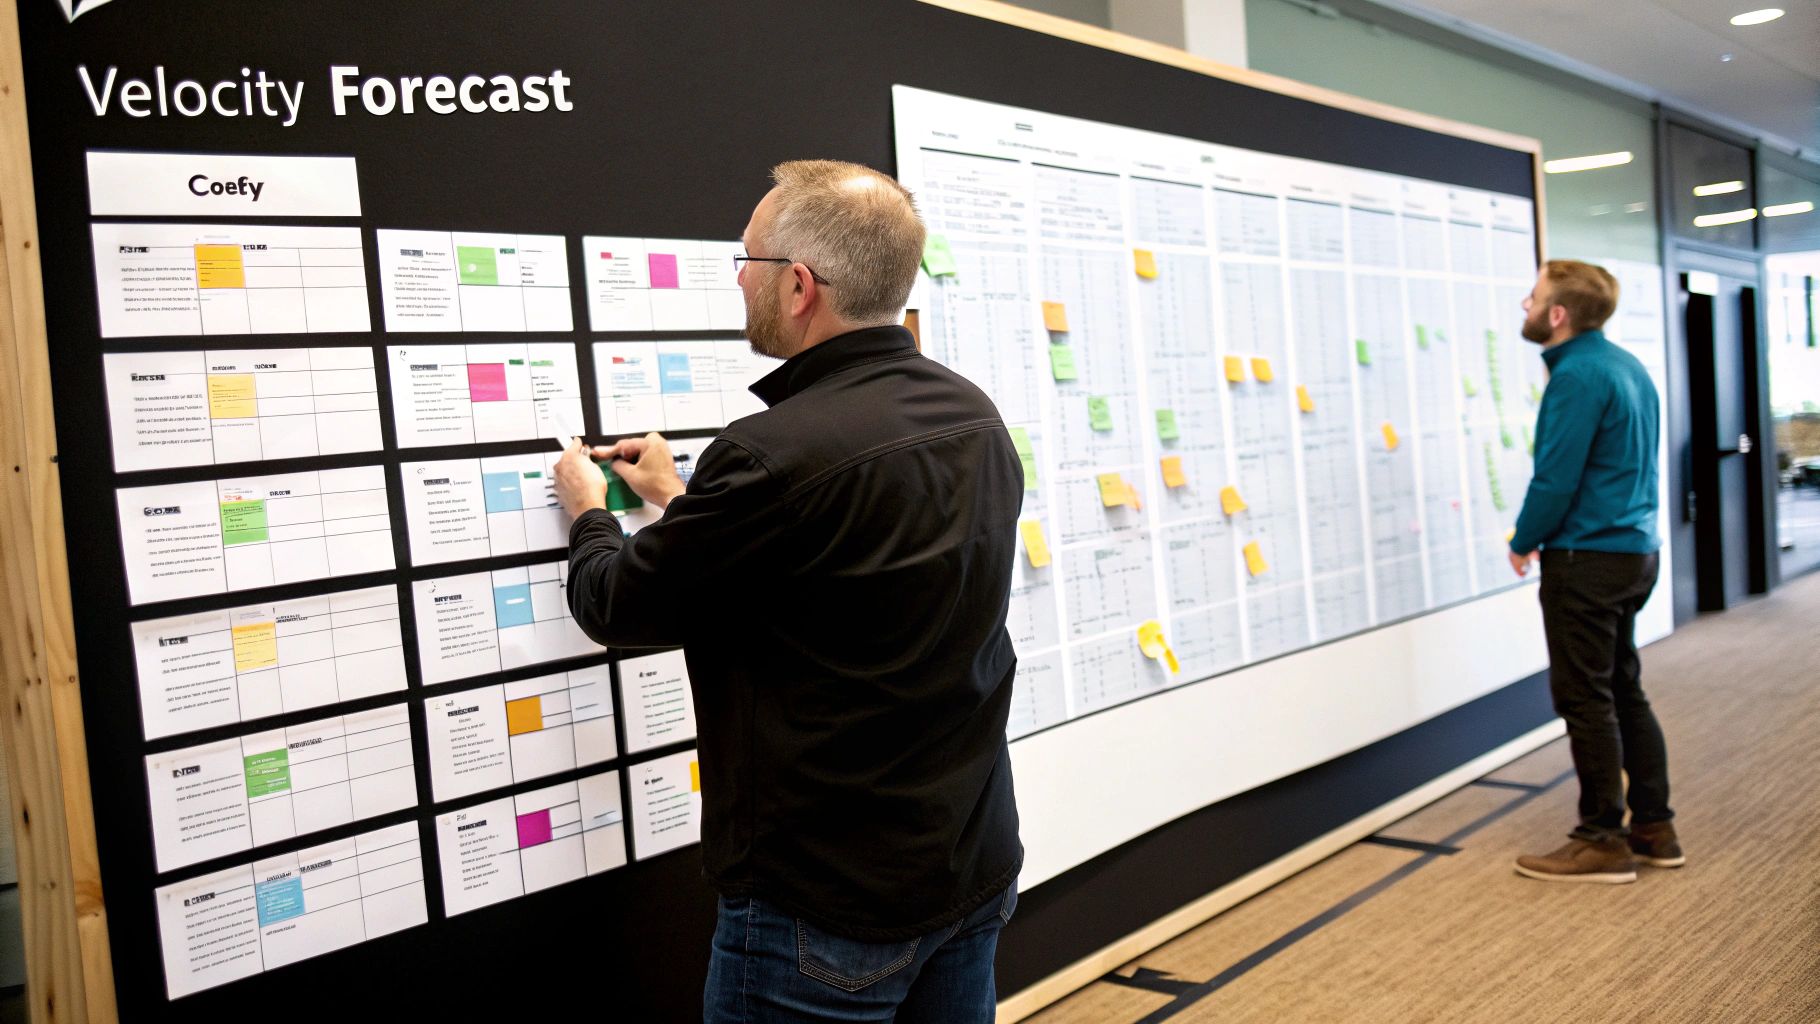
Once your team has a few sprints under its belt and a stable average velocity, you can stop guessing and start forecasting. This is where velocity in agile really proves its worth. It gives you a data-backed way to answer that all-important question from stakeholders: “So, when will it be done?”
Instead of pulling deadlines out of thin air, you can ground your release plans in actual, historical performance. This simple shift takes the emotion and wishful thinking out of the planning process, helping you set expectations you can actually meet.
From Backlog to Timeline: A Simple Formula
The math for a basic forecast couldn’t be simpler. Just divide the total story points in your product backlog by your team’s average velocity. The result is a solid estimate of how many sprints it’ll take to get everything done.
Let’s look at a quick example:
- Total Backlog Size: 200 Story Points
- Team’s Average Velocity: 25 Story Points per Sprint
- Calculation: 200 / 25 = 8 Sprints
With this calculation in hand, you can confidently tell stakeholders the project will likely take around eight sprints. It’s a forecast rooted in reality, which is far more credible than an arbitrary date and helps everyone get on the same page.
Communicating Uncertainty with Velocity Ranges
Let’s be honest—software development is full of surprises. Giving a single, fixed delivery date can paint you into a corner and set your team up for failure if things go sideways. A much smarter approach is to forecast a range based on the natural ups and downs of your team’s velocity.
All you have to do is look at your team’s best and worst recent sprints to create optimistic and pessimistic scenarios.
A forecast isn’t a promise etched in stone; it’s a probabilistic statement about the future. Using a range respects the inherent uncertainty of complex work and helps stakeholders understand the ‘cone of uncertainty’—the idea that forecasts become more accurate as you get closer to the delivery date.
Let’s revisit our team with the 200-point backlog, but this time, we’ll factor in their velocity fluctuations:
- Pessimistic Forecast (Lowest Velocity): 20 points/sprint → 200 / 20 = 10 sprints
- Optimistic Forecast (Highest Velocity): 30 points/sprint → 200 / 30 = ~7 sprints
Now, you can have a much more nuanced conversation: “Based on our current data, we forecast this project will take between 7 and 10 sprints.” This approach is transparent about the built-in variables while still giving stakeholders a useful planning window. It’s also a good reminder that velocity is just one of several software engineering productivity metrics you need to get a complete picture of team performance.
Avoiding Common Velocity Pitfalls
While agile velocity is a fantastic tool for forecasting, it’s also one of the most abused metrics out there. When you get it wrong, it stops being a helpful guide and quickly becomes a source of stress, mistrust, and bad habits. Knowing the common traps is the best way to keep the metric useful.
These mistakes almost always come from a basic misunderstanding of what velocity actually is: a historical average of what one specific team can get done. It’s not a universal scorecard for productivity. The moment you start treating it like one, you’ve already lost.
Pitfall 1: Comparing Velocity Between Teams
This is probably the single most destructive mistake a manager can make. It’s so tempting to see Team A with a velocity of 40 and Team B with 25 and jump to the conclusion that Team A is “better.” But that comparison is completely meaningless.
Why? Because story points are relative, and they’re unique to the team doing the estimating. What Team A calls a “5-point story” could be wildly different in effort and complexity from what Team B considers a “5.” They’re working off entirely different scales that they’ve calibrated internally.
Comparing velocity between two agile teams is like comparing the temperature in Celsius and Fahrenheit without doing the conversion. The numbers aren’t measuring the same thing, so putting them side-by-side tells you nothing useful.
Instead of comparing the raw numbers, look at how stable and predictable each team’s velocity is. A team that consistently hits its forecast is a reliable team, no matter what the final number is.
Pitfall 2: Weaponizing Velocity as a Performance Metric
As soon as velocity gets tied to performance reviews or bonuses, the game is over. The metric is instantly compromised. Teams will feel pressured to make the number go up, which leads to all sorts of unhealthy behaviors.
This pressure creates “point inflation,” where teams start slapping higher point values on work without any real increase in complexity. The velocity chart might look like it’s trending up, but the actual value being shipped to customers stays flat—or even drops as quality is sacrificed to hit the numbers.
- Symptom: You notice estimates for similar-sized tasks start creeping up over time.
- Symptom: The team starts avoiding important but low-point work, like bug fixes or paying down technical debt.
- Symptom: Retrospectives become about defending the velocity number instead of finding ways to actually improve the process.
The goal isn’t to have the highest velocity; it’s to create a steady, predictable flow of value. Metrics like Cycle Time often give a much healthier picture of team efficiency. We have a whole guide that dives into the cycle time meaning if you want to learn more.
Pitfall 3: Pushing for Constant Increases
Another classic mistake is when leadership demands that velocity must go up every single sprint. A mature, high-performing agile team’s velocity shouldn’t grow forever—it should level out. A stable velocity is the hallmark of a predictable system you can count on.
Demanding more points sprint-over-sprint ignores the reality of software development. Teams need to spend time on crucial work that doesn’t always come with a big point value, like:
- Refactoring code to reduce technical debt
- Fixing bugs from past releases
- Improving their own tools and deployment pipelines
This maintenance work is absolutely essential for the long-term health and speed of the team. Forcing everyone to chase points just ensures this work gets pushed aside, creating bigger, hairier problems later on. A healthy team’s velocity will naturally bounce around within a stable range. That’s not a problem; it’s a sign of a healthy process.
Adapting Velocity for AI-Assisted Workflows

AI coding assistants are changing how development teams work every day, and that means our metrics for velocity in agile have to change, too. These tools can seriously ramp up the amount of code a team produces, which can lead to a sudden jump in the story points they complete each sprint.
But a higher velocity number doesn’t tell you the full story. Just because you’re producing more doesn’t automatically mean you’re delivering more value. The big question is no longer just “how much did we get done?” It’s now “how did we get it done, and what’s the quality of that work?”
Beyond Raw Output: The New Complexities
AI-generated code brings new challenges to the table that a simple velocity number just can’t track on its own. A big story point count could be hiding problems that will cause headaches down the road.
Here are a few of those new complexities to think about:
- Hidden Technical Debt: Was the code the AI wrote clean, easy to maintain, and in line with your team’s standards? Or did it create a tangled mess that will be a nightmare to fix later?
- Increased Review Time: Sure, the code got written faster. But does it now take senior developers way more time to review, test, and debug it?
- Skill Gaps: Does the team actually understand the code the AI produced well enough to support it in the long run? Or are they just shipping a black box and hoping for the best?
If you ignore these questions, your velocity metric can quickly become a vanity metric. It might look great on a chart, but all the while, your codebase is slowly filling up with risk.
True progress in an AI-assisted environment isn’t just about shipping more points; it’s about shipping high-quality, maintainable solutions faster and more predictably. This requires a deeper level of visibility into the new workflows.
Gaining Visibility into AI Workflows
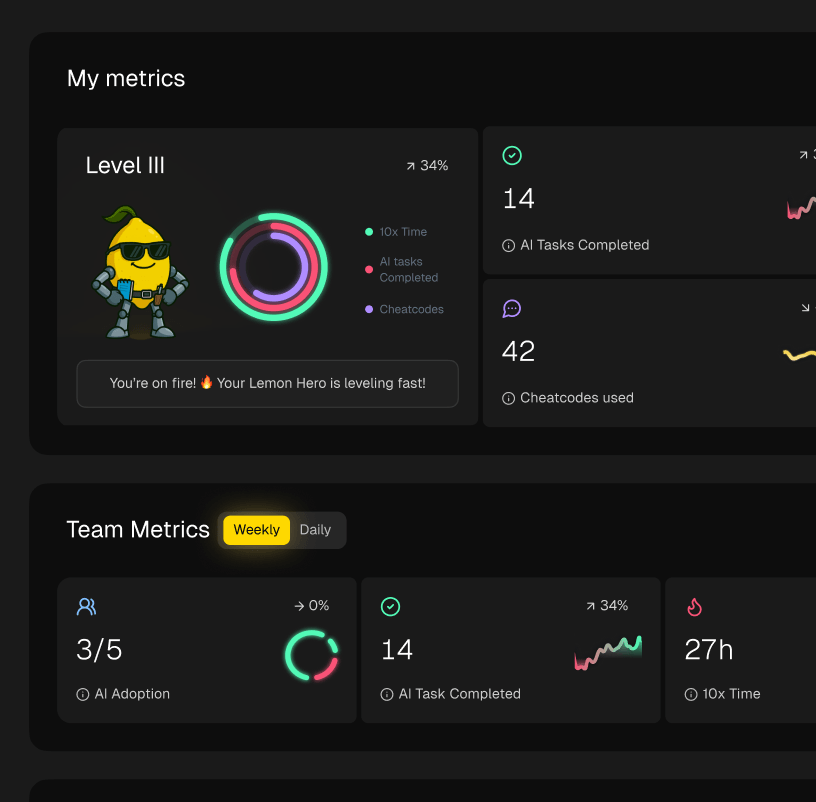
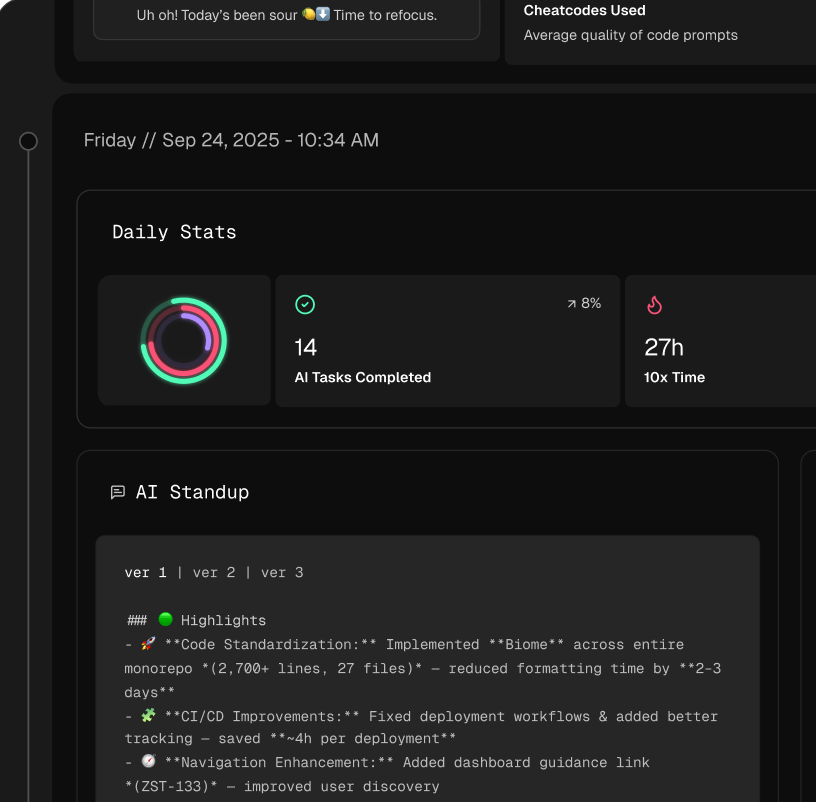
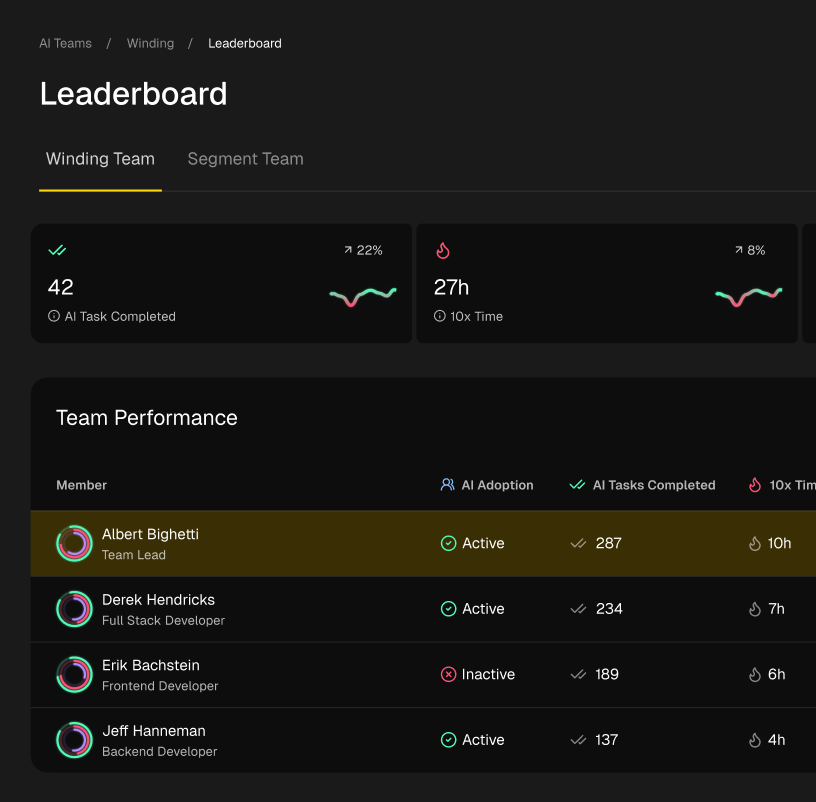
This is where modern tools are an absolute must. To really get a handle on this, teams need to see how using AI actually connects to sprint outcomes. Tools like Zest are designed for exactly this, offering AI Metrics that give you the visibility you need into these new workflows.
Instead of just looking at the final story point number, these tools help you ask the right questions. For instance, you can see if the sprints with the most AI usage also led to a spike in bugs or needed more refactoring work in the next sprint. This kind of insight helps teams figure out which AI strategies are truly speeding things up and which are just creating the illusion of progress. By seeing these patterns, teams can fine-tune their approach and make sure their velocity in agile stays a reliable measure of sustainable progress.
To truly adapt, a deep dive into AI-powered workflow automation is essential, offering ways to optimize processes. Ultimately, bringing AI into the mix calls for a more sophisticated way of measuring team performance and developer productivity. For a wider view on this, check out our guide on productivity for developers.
Got Questions About Agile Velocity? We’ve Got Answers.
Alright, let’s tackle some of the most common questions that come up when teams first start working with velocity in agile. Getting these concepts straight from the get-go is the secret to using this metric effectively and avoiding a lot of headaches down the road.
What’s the Difference Between Velocity and Capacity?
This one trips up a lot of people, but it’s actually pretty simple when you think about it.
Velocity is what your team has done. It’s a backward-looking average of the work they’ve completed over the last few sprints. Think of it as their proven performance, based on real, historical data.
Capacity, on the other hand, is all about what your team can do in the next sprint. It’s a forward-looking number that accounts for things like vacation days, company holidays, and other appointments that take people away from their keyboards. You use capacity to plan the immediate sprint, while velocity helps you forecast further out.
Can a Team Really Have a Velocity of Zero for a Sprint?
Yep, it can happen. It’s not common, and it’s definitely a sign that something is seriously wrong, but it’s possible. A velocity of zero means the team didn’t complete a single user story to the “definition of done.”
When this happens, you need to hit the brakes and hold a serious retrospective. A zero-velocity sprint is a massive red flag. The cause could be anything—maybe the team was swamped with external blockers, the sprint goal changed halfway through, or the work was way more complex than anyone realized. It’s a clear signal to stop and solve the root problem before even thinking about the next sprint.
A sprint with zero velocity isn’t a failure—it’s a powerful, albeit painful, data point. It forces the team to confront the biggest impediments to their progress head-on.
How Long Until We Have a Stable Velocity?
For a brand-new team, you can expect it to take about three to four sprints to find a consistent rhythm. Don’t be surprised if the velocity numbers are all over the place at first. That’s totally normal.
Those initial sprints are a shakedown period. The team is figuring out how to work together, getting better at estimating, and learning the ins and outs of the project. Once they get past that initial learning curve, their average velocity becomes a much more trustworthy tool for planning and forecasting.
Master Velocity Forecasting
Use your team's historical data to build predictable delivery timelines and avoid common pitfalls.
📊 Core Metrics
- Average Velocity — Rolling average of completed story points from the last 3-4 sprints.
- Velocity Stability — The variance between your highest and lowest velocity; a smaller range is better.
- Forecast Accuracy — How often your velocity-based predictions match actual delivery timelines.
🕹️ My Cheatcodes
- 🌱 Forecast, Don't Promise — Treat velocity as a guide for planning, not an ironclad commitment.
- 🦎 Protect the Metric — Never compare velocity between teams or use it as a performance weapon.
- ⚡ Stabilize Before Optimizing — Focus on achieving a predictable rhythm before trying to increase the number.
📈 Reflection Points
- 💡 Is our estimation process consistent sprint over sprint?
- 🧩 What external blockers are impacting our ability to complete work?
- 📘 Are we sacrificing quality or skipping non-story work to inflate our velocity number?
Gallery
Lemon shots