Boost software development velocity: Measure, Optimize, and Deliver Faster

Software development velocity is how much work a team can get done in a single sprint. We usually measure it in story points. Think of it less as a raw speed metric and more as a way to forecast what the team can handle in the future, helping them maintain a predictable and sustainable pace.
Beyond Speed: A True Definition of Velocity
In engineering, it’s easy to get caught up in the flurry of activity. Teams can look incredibly busy, pushing code and closing tickets left and right. But if all that hustle doesn’t lead to predictable, shippable value for the customer, how effective is it really? This is where the concept of software development velocity cuts through the noise. It helps us shift the question from, “How fast are we working?” to, “How much value are we consistently delivering?”
Let’s use an analogy. Imagine a team of chefs in a busy kitchen. Raw speed might be how quickly they can chop vegetables. Velocity, on the other hand, is the number of complete, delicious meals they serve to happy customers every hour. The chopping is a necessary task, but only the finished meals represent true, valuable output. In the same way, software development velocity isn’t about counting lines of code; it’s about measuring the amount of fully completed, user-facing work delivered in a set period.
The Core Components of Velocity
At its heart, velocity is a simple yet powerful metric. It’s built on a few key ideas that help teams plan their work and actually deliver on those plans. Getting a handle on these components is the first step to using velocity as a tool for improvement, not a stick to beat people with.
- Story Points: These are abstract units that teams use to estimate the relative effort a task requires. Story points aren’t about hours; they capture the complexity, risk, and overall work involved.
- Sprints: A sprint is just a fixed timebox—usually one to four weeks—where the team commits to completing a specific set of tasks from their backlog.
- Predictable Output: This is the real prize. The whole point of tracking velocity is to establish a predictable delivery rhythm. By averaging the story points completed over the last few sprints (usually 3-5), a team can get a much clearer picture of what they can realistically take on next.
This simple practice makes a huge difference in planning. Velocity tracking, born out of Agile methodologies, has become essential for turning chaotic backlogs into data-driven roadmaps. In fact, research shows that teams who consistently track their velocity can improve their estimation accuracy by around 40%. That makes it an indispensable tool for reliable project forecasting. Discover more insights about these findings on monday.com.
To quickly recap these foundational ideas, here’s a simple breakdown.
Velocity At A Glance: Key Concepts
| Concept | Brief Explanation | Primary Goal |
|---|---|---|
| Story Points | An abstract unit measuring the effort, complexity, and uncertainty of a task. | To estimate work without tying it directly to time, which can be misleading. |
| Sprints | A fixed-length timebox (e.g., 2 weeks) for completing a set amount of work. | To create a consistent rhythm for planning, executing, and delivering work. |
| Predictable Output | The average amount of work (in story points) a team completes per sprint. | To forecast future capacity and make reliable commitments to stakeholders. |
Understanding these building blocks helps frame velocity in the right context.
Velocity is a measurement of output over time, not a measure of productivity or efficiency. Its primary purpose is forecasting. When used correctly, it empowers a team by giving them a realistic view of their capacity, fostering trust and transparency with stakeholders.
How To Accurately Measure And Track Velocity
So, you understand what velocity is. Now, how do you actually start measuring it without turning it into a soul-crushing numbers game? It’s all about creating a practical, repeatable system that helps your team forecast work and get better over time. The real goal here is to find a reliable baseline so your team can make commitments they can actually stand behind.
The very first thing you need to do is decide on your unit of measurement. This decision is the bedrock for everything that follows, so picking the right one for your team’s culture and workflow is a big deal.
Story Points Or Ideal Hours
When it comes to measuring effort in an Agile world, two options dominate the conversation: story points and ideal hours. Each comes with its own mindset and real-world trade-offs.
-
Story Points: This is an abstract unit meant to capture the total effort needed to get a task done. It’s a blend of complexity, risk, and the sheer volume of work. Teams often use a Fibonacci-like scale (1, 2, 3, 5, 8, 13…) to keep estimates relative and prevent anyone from thinking “1 point = X hours.”
-
Ideal Hours: This unit tries to estimate the number of focused, no-distractions-allowed hours a task would take to complete. It sounds straightforward, but it can be a trap. It completely ignores the reality of a developer’s day—meetings, code reviews, context switching, and the impromptu “quick question” that never is.
For this reason, most seasoned teams gravitate toward story points. They smartly decouple the work from the clock, shifting the conversation to the task itself, not who can type the fastest. It just makes for a healthier and more honest estimation process.
Establishing A Baseline With Planning Poker
Once you’ve settled on a unit, it’s time to estimate the work sitting in your backlog. One of the best and most popular ways to do this is Planning Poker. It’s a simple, consensus-driven game that gets the entire team involved, which almost always leads to better, more realistic estimates.
Here’s the rundown of how it works:
- The product owner presents a user story and explains the “why.”
- The team digs in, asks questions, and clarifies any fuzzy details.
- Each person privately picks a card with their story point estimate.
- On the count of three, everyone flips their card over.
- If the numbers are all over the place, the folks with the highest and lowest estimates explain their thinking. This is where the magic happens—you uncover hidden assumptions and complexities you would have otherwise missed.
- You repeat the process until the team lands on a number everyone can agree on.
This isn’t just about getting a number; it’s a powerful way to build a shared understanding of the work before a single line of code is written.
This visual shows the simple yet powerful flow of using velocity to create predictable outcomes.
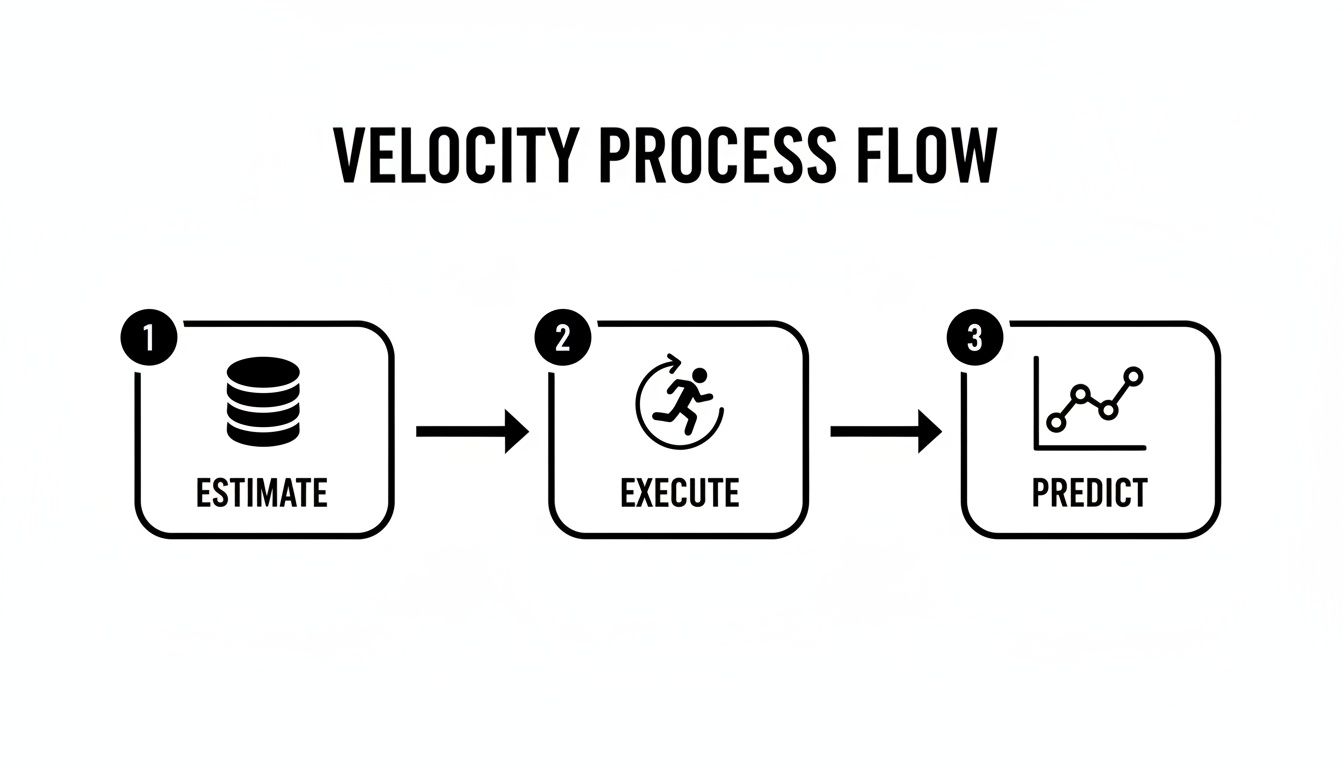
It all starts with that collaborative estimation, flows through the actual work of the sprint, and gives you the data you need to make solid predictions for the future.
Tracking Progress With Velocity Charts
With your backlog estimated, you can finally start tracking your team’s output. Thankfully, you don’t need a complicated spreadsheet. Most Agile tools like Jira or Azure DevOps have built-in reports to visualize your software development velocity.
The most critical report is the velocity chart. It’s a simple bar chart that shows two things for each sprint: the story points the team planned to do versus the points they actually finished.
After just 3-5 sprints, this chart becomes your crystal ball. You can calculate your team’s average velocity, giving you a data-backed baseline for how much work you can realistically take on in the next sprint. It’s no longer a guess; it’s a forecast.
As you get comfortable with this, it’s also a good time to learn how to measure team productivity without micromanaging, which builds a culture of trust. For a deeper dive into interpreting these charts, check out our full guide on how to measure velocity: https://meetzest.com/blog/how-to-measure-velocity. A stable, predictable velocity isn’t just a nice-to-have metric; it’s the signature of a healthy, mature team that has its process dialed in.
Common Pitfalls and Misconceptions To Avoid
While software development velocity can be a fantastic tool for forecasting and planning, it quickly turns toxic when people don’t understand what it’s really for. The moment you treat velocity as a target to be hit, instead of an indicator to be read, you’ve turned a helpful metric into a source of team anxiety and burnout. When velocity becomes a weapon, it loses all its diagnostic power.
Instead of helping you become more predictable, misusing velocity just creates a culture of fear. The team’s focus shifts from shipping high-quality work to just hitting an arbitrary number. Let’s walk through the most common traps managers and teams fall into so you can spot them—and fix them—before they cause real damage.
The Comparison Trap
One of the most destructive mistakes you can make is comparing the velocity of different teams. I get it, it seems like an easy way to see which team is “better” or “faster,” but it’s a completely broken way of thinking. A team’s velocity is its own unique fingerprint, shaped by its specific context.
Remember, story points are relative, not absolute. A “5-point” story for Team A, which works on backend APIs, is a completely different beast than a “5-point” story for Team B, which is deep in front-end UI work. Their skills, their technical hurdles, and even how they collectively define complexity are unique to them.
Comparing velocity between two teams is like comparing the speed of a speedboat and a cargo ship. Both are moving effectively for their purpose, but their speed measurements aren’t interchangeable. One isn’t inherently “better” than the other; they are just optimized for different tasks.
Using Velocity as a Performance Metric
This one is critical: never, ever use velocity to measure how well an individual developer is performing. It’s not just inaccurate; it’s a great way to destroy team morale and psychological safety. When engineers feel their job is on the line based on how many story points they close, the whole system starts to game itself.
This pressure cooker environment leads to all sorts of bad habits:
- Inflating Estimates: During planning, you’ll see developers arguing for higher point values, not because a task is genuinely complex, but because they need to hit their perceived quota.
- Cutting Corners: To “finish” more points faster, people start rushing. Proper testing gets skipped, documentation is an afterthought, and code reviews become a rubber stamp. Hello, technical debt.
- Cherry-Picking Tasks: Team members will naturally grab the easy, high-point tasks first, leaving the gnarly but critical work to sit untouched in the backlog.
Velocity is a team-level metric. Full stop. It reflects what a group of people can accomplish when they work together. Using it to single out individuals just creates competition right where you need collaboration the most.
Ignoring the Human Factor
At the end of the day, a velocity chart is just a reflection of a messy, complex system made up of people, processes, and technology. When you see a sudden drop in velocity, it’s rarely a sign that the team got lazy. More often, it’s a smoke signal that something deeper is going on.
What could be causing that dip?
- Unplanned Work: Constant interruptions, urgent bug fixes, or surprise requests from other departments can easily throw a sprint off the rails.
- Team Burnout: If a team has been running at 110% for too long, a drop in velocity is an early warning sign that they’re exhausted.
- Technical Debt: All those little shortcuts and bits of messy code add up. Eventually, they make every new feature harder to build, grinding velocity to a halt.
- External Blockers: Sometimes the team is just stuck, waiting on another department, a third-party vendor, or a key decision from leadership.
A great manager doesn’t look at a dip in the chart and ask, “Why are you slower?” They ask, “What got in our way?” This small change shifts the entire conversation from blame to problem-solving. It keeps velocity what it should be: a tool for getting better, not a stick to beat people with.
Interpreting What Your Velocity Trends Are Telling You
Your velocity chart is much more than a bunch of bars on a graph. It’s telling a story about your team’s rhythm, its health, and how predictable it can be. Learning to read that story is the real key—it’s what separates teams that just react to problems from those that get ahead of them. When you can analyze the trends, you move past just tracking numbers and start having real conversations about getting better.

Think of the patterns in your software development velocity chart as diagnostic tools. A steady, consistent velocity usually points to a mature, high-functioning team that has its process dialed in. On the flip side, a chart that’s all over the place often signals some deeper issues that need a closer look.
Decoding the Patterns in Your Velocity Chart
Different trends tell very different stories. Getting a handle on these common patterns helps you ask the right questions in your retrospectives and find the root cause of a problem, instead of just patching up the symptoms. It’s all about finding the signal in the noise.
A consistently stable or slowly climbing velocity? That’s the sweet spot. It means your team has found a sustainable pace, their estimates are pretty reliable, and they have a solid grip on their workflow. This predictability is what we’re all aiming for when we track velocity.
Then there’s the erratic, unpredictable chart. This is a major red flag. One sprint, the team knocks out 40 points, but the next, it’s only 15. This kind of volatility is often caused by external disruptions or internal friction that you need to address right away.
Your velocity chart isn’t a report card; it’s a health monitor. An erratic heartbeat is a sign to investigate the underlying cause, not to demand that the heart beat more steadily. The same applies to your team’s output.
But perhaps the most worrying trend is a steady decline. If you see velocity dropping sprint after sprint, it’s a huge early warning sign. It could be creeping technical debt making every new task harder, or it could be a sign that your team is burning out. Ignoring this trend is a fast track to missed deadlines and sinking morale.
Turning Data Into Action
Once you spot a pattern, the real work begins: turning that observation into a productive conversation. The numbers don’t give you the answers, but they give you the perfect place to start a collaborative investigation with your team.
Here’s a quick guide to understanding what different trends in your velocity chart might be telling you about your team’s health and processes.
Interpreting Common Velocity Patterns
| Velocity Trend | Potential Cause | Recommended Action |
|---|---|---|
| Stable and Predictable | The team has a mature process, accurate estimation, and minimal interruptions. | Celebrate and Protect: Acknowledge the team’s consistency and continue to shield them from unplanned work. |
| Erratic (Up and Down) | Unclear requirements, constant context switching, or unresolved dependencies. | Investigate Blockers: Use retrospectives to identify the source of unpredictability. Ask, “What pulled us away from our sprint goals?” |
| Steadily Declining | Mounting technical debt, team burnout, or poorly defined user stories. | Address Systemic Issues: Dedicate sprint capacity to paying down tech debt or hold workshops to improve backlog refinement. |
| Sudden Spike or Drop | An unusually easy/hard sprint, team members on vacation, or a change in team composition. | Normalize and Observe: Acknowledge the anomaly, understand its cause, and see if the trend returns to the baseline in the next sprint. |
When you use these patterns as conversation starters, you turn raw data into a powerful tool for empowering your team. The goal isn’t to chase a specific number but to create a smooth, predictable flow of value. This approach builds a culture where the team owns its process and is always looking for ways to make it better.
Actionable Strategies To Improve Your Team Velocity
Knowing your software development velocity is a great starting point, but it’s just a number. The real magic happens when you use that insight to make meaningful, sustainable improvements. The goal isn’t to crack the whip and make people work faster; it’s about removing the friction that slows them down, so they can deliver value smoothly and predictably.

This means taking a hard look at three key areas: your development processes, your technical foundation, and your team’s culture. You’d be surprised how small, targeted tweaks in each of these can lead to huge long-term gains in shipping high-quality software on a regular cadence.
Refine Your Processes
Inefficient processes are like trying to run in a swimming pool—no matter how hard your team kicks, they’ll struggle to get anywhere fast. Streamlining these core activities is often the lowest-hanging fruit for improving velocity.
It all starts with a well-groomed backlog. When stories are clear, detailed, and properly estimated before a sprint even kicks off, the team can hit the ground running. Vague or oversized tickets are a recipe for confusion and mid-sprint delays.
Another huge velocity killer is scope creep. The team commits to a plan, only to get hit with a constant stream of “urgent” new requests. You have to protect the sprint; it’s non-negotiable if you want to maintain focus and predictability.
A sprint backlog should be a fortress, not a suggestion box. Shielding the team from interruptions allows them to enter a state of deep work, which is where real progress happens. This discipline is essential for building a stable velocity.
Invest in Technical Excellence
A shaky technical foundation is like building a skyscraper on sand. Sure, you can add a few floors, but eventually, the entire structure becomes wobbly and slow to work with. Investing in your codebase and infrastructure pays off massively when it comes to velocity.
Here are a few key areas to focus on:
- Automated Testing and CI/CD: A solid continuous integration and continuous deployment (CI/CD) pipeline takes the tedious, error-prone tasks of building, testing, and deploying code off your developers’ plates. This frees them up to focus on what they do best: writing great features.
- Strategic Tech Debt Repayment: Every codebase has technical debt. The trick is not letting it pile up. Carve out a portion of each sprint (a good starting point is 10-20% of capacity) to refactor old code, upgrade libraries, and improve architecture. Think of it as preventative maintenance that keeps your codebase healthy and easy to navigate.
Improving code quality through practices like thorough code reviews is also a must. You can streamline this with automated tools that provide immediate feedback, catching issues early and easing the manual burden on your senior developers. If you want to dive deeper, check out our guide on automatic code review.
Foster a Culture of Collaboration
At the end of the day, software development is a team sport. A team with a strong, collaborative culture will always outperform a group of brilliant but siloed individuals. Creating an environment of psychological safety and shared ownership is one of the most powerful things you can do to boost velocity.
Encouraging practices like pair programming and mob programming can be incredibly effective. When developers tackle complex problems together, they share knowledge, spot bugs earlier, and often produce higher-quality solutions in less time. It might feel a bit slower for a single task, but it accelerates the team’s overall capability and resilience.
Clear and consistent communication is the glue that holds it all together. Daily stand-ups, transparent retrospectives, and open channels for asking questions make sure everyone is aligned and blockers get resolved quickly. When people feel safe enough to say, “I’m stuck,” the entire team can jump in to help, stopping small hurdles from turning into major delays.
The Future of Velocity With AI-Assisted Workflows
Artificial intelligence isn’t just a buzzword anymore; it’s fundamentally reshaping how software gets built. AI assistants are quickly becoming a standard part of the toolkit inside VS Code, Cursor, and other IDEs, changing the way developers write, test, and debug their code. This shift is a massive opportunity, but it also throws a wrench into how we’ve traditionally measured software development velocity.
Think about it: how do you estimate a task with story points when an AI assistant can knock it out in minutes, while it might have taken a developer hours? Our old ways of measuring just don’t fit this new reality. To truly understand a team’s output in the age of AI, we need a completely new approach—one that relies on modern tooling to give us a clear picture.
Making AI Workflows Visible
Simply giving developers access to AI assistants without any insight into how they’re being used is like flying blind. Sure, you might feel like you’re moving faster, but you have no idea why, where the rough patches are, or how to repeat your successes. The real trick is to bring what’s happening inside these AI-powered sessions out into the open.
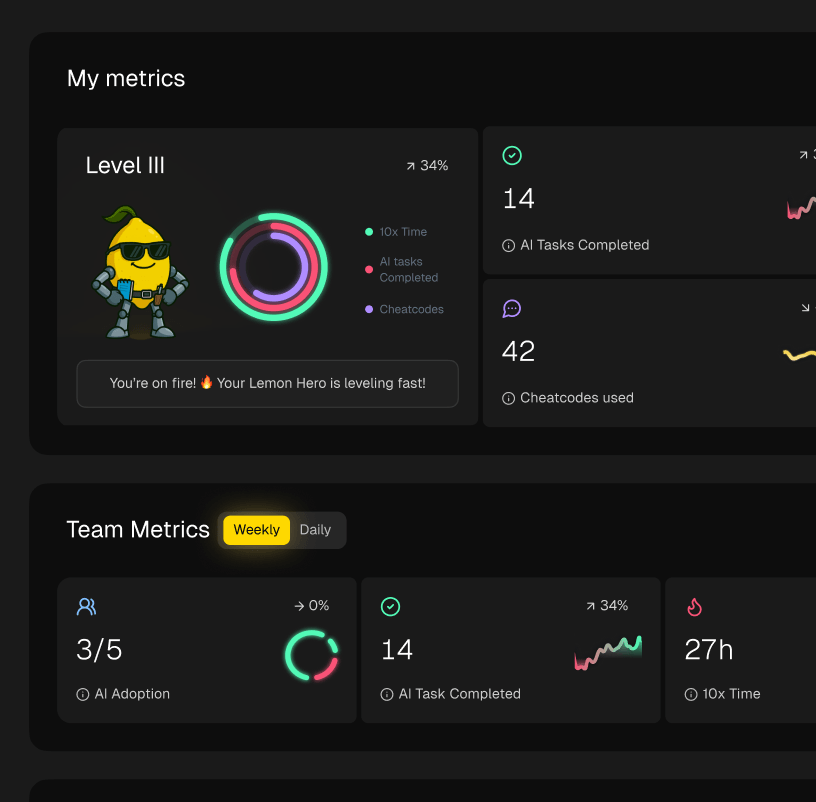
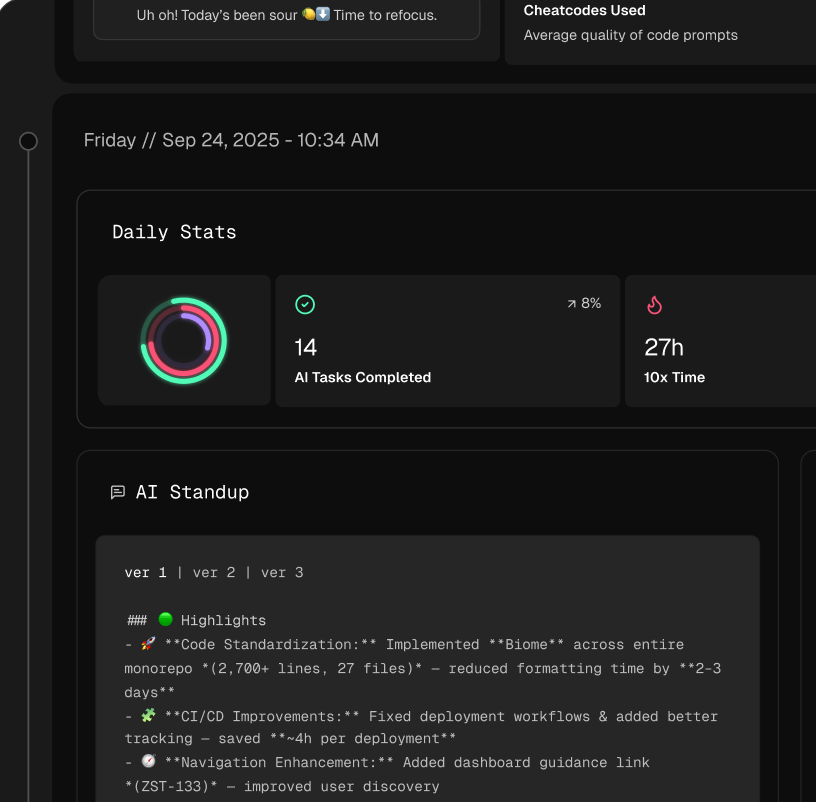
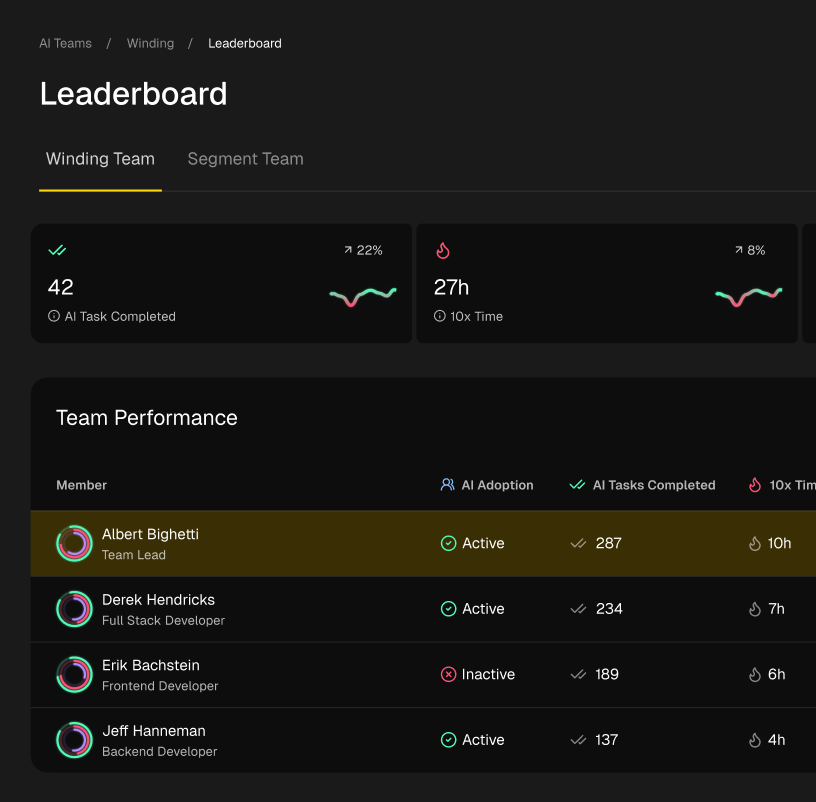
This is where workflow managers like Zest come in. They turn what used to be isolated, individual AI interactions into shared knowledge for the whole team. With automated summaries and metrics, you can start to see:
- AI-Assisted Wins: Pinpoint exactly where AI gave your team the biggest boost, like generating complex boilerplate code or refactoring a clunky legacy function.
- Time Saved: Put a real number on the impact of AI on getting tasks done, adding a powerful new data point to your velocity calculations.
- Common Blockers: See where developers are getting stuck, even with AI’s help. This highlights perfect opportunities for better training, new tools, or clearer processes.
From Individual Hacks to Team-Wide Best Practices
As AI becomes more and more a part of the daily development grind, concepts like prompt engineering are becoming essential skills. When a developer stumbles upon a brilliant prompt or workflow—a “cheat code” that saves a ton of time—that knowledge shouldn’t stay locked away with one person. You can learn more about how developers are adapting to this new reality through AI pair programming.
The goal is no longer just to measure what a team produces. It’s to understand and replicate the high-impact patterns that lead to great results. By sharing what works, teams can lift everyone’s skills, turning individual discoveries into standard practice for the entire organization.
In today’s fast-moving world of software, deployment frequency is a critical sign of a team’s velocity. Top-performing teams, according to benchmarks like the DORA metrics, are deploying to production multiple times a day. As AI tools become common in VS Code and Cursor, tools like Zest are helping push this even further by automatically surfacing AI-assisted wins, blockers, and time saved. This new layer of insight helps teams supercharge their deployment cadence, turning velocity from a backward-looking metric into a proactive tool for getting better every single day.
Still Have Questions About Velocity?
Once you start using software development velocity, you’ll quickly run into a few common “what-if” scenarios. How you handle these can make the difference between a helpful metric and a source of team frustration. Let’s walk through some of the most frequent questions that pop up.
Getting these details right is all about fine-tuning the process for your team. When everyone’s on the same page, you get consistent, reliable data that actually reflects what your team can accomplish.
How Should We Handle Bugs and Chores?
This one comes up all the time. The simple answer? Point everything that requires effort. If fixing a bug or tackling a technical chore takes up your team’s time, it needs to be estimated and counted in your velocity.
If you don’t, you create an incomplete picture of where your team’s energy is going. Assigning story points to bugs and chores makes that “invisible” work visible. This is incredibly helpful when explaining to stakeholders why a sprint might be light on new features but was still packed with crucial work on system stability or paying down tech debt.
What Is a Good Velocity Score?
Let’s be clear: there is no such thing as a “good” or universal velocity score. A team with a velocity of 20 isn’t automatically worse than a team with a velocity of 50. Story points are relative estimates, unique to each team, their skills, and the complexity of their specific projects.
The real goal isn’t to hit a high number. It’s to find a stable and predictable one. A consistent velocity—no matter the actual number—is the hallmark of a mature team. It means you can forecast and plan with confidence. Chasing a higher score just encourages inflated estimates and leads to burnout.
How Often Should We Recalculate Average Velocity?
You should be looking at a rolling average, typically based on the last 3 to 5 sprints. This timeframe is the sweet spot—it’s long enough to smooth out the highs and lows of an unusual sprint but short enough to reflect how your team is working right now.
Using too much history can skew your average with outdated information, especially if your team’s size or process has changed. Recalculating this moving average after each sprint keeps your forecasting sharp and adapts to the natural evolution of your team.
Ready to turn velocity data into actionable insights and streamline your development process? Zest provides the visibility you need to identify bottlenecks, share best practices, and build a culture of continuous improvement. Discover how Zest can help your team ship faster.
Boost Your Velocity Workflow
Turn velocity from a passive metric into an active tool for forecasting, improving team health, and delivering value faster.
📊 Core Velocity Metrics
- Average Velocity — Your rolling 3-5 sprint average for predictable forecasting.
- Predictability Score — The ratio of completed points to committed points, showing estimation accuracy.
- Work Distribution Ratio — The percentage of effort spent on new features vs. tech debt vs. bugs.
🕹️ My Cheatcodes
- 🌱 Predictability Over Peak Performance — A stable, consistent velocity is always more valuable than a high but erratic one.
- 🦎 Point Everything That Takes Effort — Make invisible work like bugs and chores visible in your velocity calculation.
- ⚡ Use Trends as Conversation Starters — Treat a velocity dip as a signal to ask "What's in our way?" not "Why are you slow?".
✅ Before Your Next Sprint Planning
- 🔍 Review the velocity chart for the last 5 sprints to spot trends.
- 📊 Confirm your team's current average velocity for capacity planning.
- 🧭 Identify and discuss any blockers that caused last sprint's deviations.
- 📈 Allocate ~20% of capacity to proactive tech debt repayment.
Gallery
Lemon shots