
A Guide to Mean Time To Resolve for Engineering Teams
When a critical part of your app breaks, the clock starts ticking. Mean Time To Resolve (MTTR) measures the entire duration of that outage, from the moment an alert fires to the second your users can breathe a sigh of relief. It’s the average time your team takes to fully fix an incident—and that includes everything from diagnosis to deploying the patch and making sure it actually worked.
The Real-World Impact of Your Resolution Time

MTTR is far more than just a number you glance at on a dashboard. It’s a direct reflection of your team’s ability to handle a crisis. Elite engineering teams obsess over this metric because it’s a powerful indicator of their operational health and efficiency. A low MTTR isn’t just about being fast; it means your communication, tooling, and processes are all working together seamlessly.
Think of it like a fire department’s response. Their success isn’t just about how quickly they roll out of the station. It’s the whole operation: getting to the scene, using the right gear to put out the fire, and making sure the area is safe afterward. In the same way, MTTR covers the entire lifecycle of an incident, from start to finish.
Why MTTR Is a Bottom-Line Business Metric
Bringing your MTTR down has a direct, positive impact on the business. Every minute of downtime creates a ripple effect of negative consequences, which makes getting things back online as quickly as possible a top priority.
- Boosts Customer Trust: When you fix problems fast, you show customers you’re reliable. That builds a ton of confidence in your product.
- Cuts Down Revenue Loss: For any business that takes payments online, downtime is literally lost money. A low MTTR helps protect the bottom line.
- Improves Team Morale: No one likes a fire drill that lasts for days. Teams that can squash bugs quickly feel more empowered and are less likely to burn out from constant high-stress emergencies.
The formula itself is pretty straightforward:
MTTR = Total Resolution Time for All Incidents / Total Number of Incidents
Calculating this gives you a simple average to track your performance over time. Once you start measuring it, you establish a baseline. From there, you can spot negative trends, find weak spots in your process, and make a solid case for investing in better tools or training.
Ultimately, tracking MTTR is the first step toward building a more resilient and effective engineering culture. If you’re curious about other key metrics, check out our guide on essential DevOps performance metrics.
How to Accurately Calculate MTTR
Calculating your team’s mean time to resolve feels like it should be simple—just plug numbers into a formula, right? But the secret to getting a number you can actually trust lies in one thing: consistency.
To get a reliable metric that truly reflects your team’s performance, you first need to set some ground rules. Everyone must agree on the exact moment the clock starts and stops for any given incident. Without that clarity, your MTTR data can get messy fast, making it useless for driving real improvement.
Defining the Start and End Points
So, when does the clock officially start ticking? It begins the moment an incident is logged. This isn’t always when the problem first appeared, but when your team is formally made aware of it and a ticket is created. That could be an automated alert firing from your monitoring system or a user submitting a bug report. That first timestamp is your starting line.
Most teams agree the clock should start at the first verifiable notification. For instance, you could decide it’s when a PagerDuty alert goes off, not when an engineer finally acknowledges it.
The finish line is just as important. An incident is only “resolved” when the fix is live in production and customers are no longer affected. It’s not over when the code is written or merged. The crisis is officially over only when the system is back to normal.
Key Takeaway: Your definition of ‘resolved’ has to be rock-solid. It must mean the service is fully restored for your end-users. Any fuzziness here will pollute your data and hide how efficient your incident response really is.
Common Pitfalls in MTTR Calculation
One of the biggest mistakes teams make is how they handle tickets put on hold. If a resolution is paused because you’re waiting on a customer for more information or stuck waiting for a third-party vendor, that time shouldn’t count against your team. Including that idle time just inflates your MTTR and makes your team look less efficient than they are. Make sure your ticketing system is configured to pause the clock for these specific statuses.
Another classic error is closing a ticket too early. A developer might mark an issue as “done” the second their code is merged, but the MTTR clock shouldn’t stop there. It needs to keep running until that code is successfully deployed and confirmed to be working in the production environment. This distinction is vital. If you want to dig into similar metrics, you can learn more about how cycle time calculations differ from lead time and why it matters.
A Practical Step-by-Step Example
Let’s make this real. Imagine a software team is tracking production bugs over a single week. To get their MTTR, they first need to calculate the total resolution time for each incident.
Here’s a simple breakdown of their week.
MTTR Calculation Example for Production Bug Fixes
| Bug ID | Time Reported | Time Resolved | Total Resolution Time (Hours) |
|---|---|---|---|
| BUG-001 | Monday 9:00 AM | Monday 1:00 PM | 4 |
| BUG-002 | Tuesday 2:00 PM | Wednesday 11:00 AM | 21 |
| BUG-003 | Friday 10:00 AM | Friday 11:30 AM | 1.5 |
With this data, the calculation is straightforward.
Here’s how it works:
- Sum the Total Resolution Times: 4 hours + 21 hours + 1.5 hours = 26.5 hours
- Count the Number of Incidents: There were a total of 3 incidents.
- Calculate the MTTR: 26.5 hours / 3 incidents = 8.83 hours
So, for this particular week, the team’s MTTR is 8.83 hours.
By tracking this number over time, engineering leaders get a clear, reliable signal. It gives them the confidence to make smarter decisions about everything from new tools and training to process improvements that actually work.
Understanding the Four Types of MTTR Metrics
Let’s be honest, the term “MTTR” gets thrown around a lot, and it’s a huge source of confusion. Why? Because it can mean four different things. When your manager says they want to lower mean time to resolve, are they talking about the entire incident from start to finish, or just the time your team spends actively fixing it? Nailing down which “MTTR” you’re talking about is the first step to figuring out where your real bottlenecks are.
Think of it like a relay race. Your total race time (the overall resolution) depends on how fast each runner completes their leg. If you only look at the final time, you’ll completely miss that your second runner is stopping for a water break.
Breaking down the incident lifecycle into these distinct phases helps you pinpoint exactly where your team is killing it and where there’s room to improve. A fantastic overall resolution time is built on a foundation of strong performance in detection, acknowledgement, and repair.
Mean Time To Detect (MTTD)
This is the starting pistol. Mean Time To Detect (MTTD) measures how long it takes your team to even realize a problem exists. The clock starts the moment an issue pops up and stops the second an alert fires or someone on the team becomes aware of it. A low MTTD is a great sign that your observability and monitoring are in good shape.
This first phase is often the longest and most expensive. In cybersecurity, for example, the financial damage from a breach is directly tied to how long it goes unnoticed. Globally, it takes an average of 241 days to handle a breach, with a jaw-dropping 181 days spent just identifying the attack. Slashing this detection window is crucial—breaches resolved in under 200 days cost way less than those that linger. You can dig into more data on how detection time impacts costs by reading about the average time to detect cyber attacks.
Mean Time To Acknowledge (MTTA)
Once an alert fires, the next runner takes the baton. Mean Time To Acknowledge (MTTA) tracks how long it takes for someone to actually pick up the alert and start working on the problem. This is a pure measure of your team’s responsiveness and how well your on-call process is working. A high MTTA could be a red flag for alert fatigue, fuzzy ownership, or gaps in your on-call schedule.
This metric is critical because it marks the first human touchpoint. You can have the best monitoring in the world, but if an alert sits there for hours, the problem is actively hurting users while your team is in the dark.
Mean Time To Repair (MTTR)
Here’s where things often get muddled. In this context, Mean Time To Repair (MTTR) is all about the “hands-on-keyboard” time. It measures the clock from when the team starts actively working on a fix to the moment that fix is ready to go. This metric isolates the technical diagnosis and remediation work, showing how good your team is at debugging, coding a solution, and pushing it through the CI/CD pipeline.
Mean Time To Resolve (MTTR)
Finally, the finish line. This is the big-picture version of Mean Time To Resolve (MTTR), covering the entire incident lifecycle. It’s the total average time from the initial alert (the start of MTTD) all the way to the moment the incident is completely over and the system is stable for users. It’s essentially the sum of all the previous stages.
MTTR (Resolve) = MTTD + MTTA + MTTR (Repair) + Verification Time
This timeline shows how each metric slots into a distinct phase of the incident response, from the first report to the final fix.
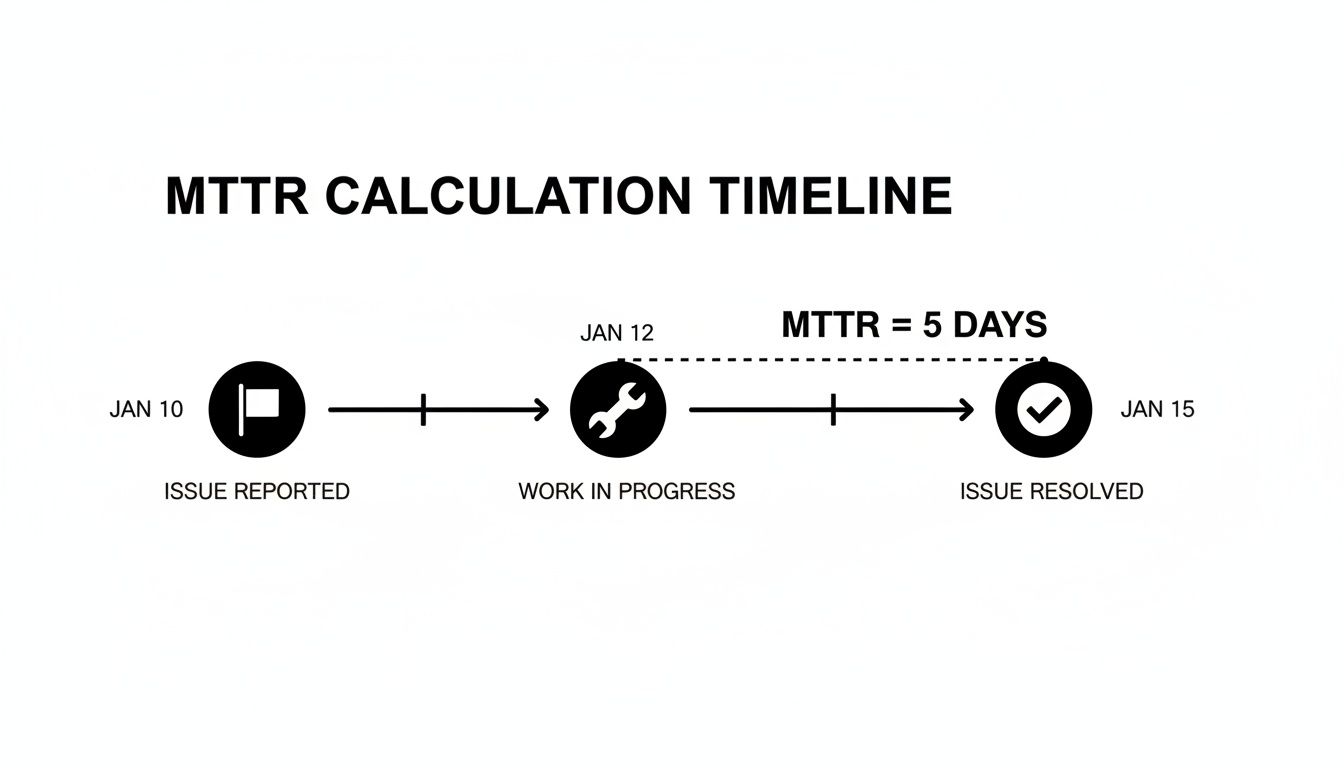
As you can see, the final resolution time isn’t just one block of effort. It’s a series of handoffs between different stages. By measuring each piece, you can quickly identify whether detection, acknowledgement, or the active repair work offers the biggest opportunity for improvement.
To help clear up any lingering confusion, it’s useful to see these four “Mean Time To…” metrics side-by-side. Each one tells a different part of the incident story.
Comparing the Key ‘Mean Time To…’ Metrics
| Metric | What It Measures | Start Point | End Point |
|---|---|---|---|
| MTTD | Time to discover an incident. | The moment an incident begins. | The moment the team is alerted. |
| MTTA | Time to respond to an alert. | The moment an alert is triggered. | The moment a team member starts working on it. |
| MTTR (Repair) | Time to fix the issue. | The moment investigation begins. | The moment the fix is implemented. |
| MTTR (Resolve) | The total time of the entire incident. | The moment an incident begins. | The moment the system is fully recovered. |
Ultimately, understanding the difference between these metrics isn’t just about semantics—it’s about gaining a more granular, actionable view of your incident response process. When you know where the delays are, you know exactly where to focus your efforts.
Actionable Strategies to Reduce Your MTTR
Measuring your mean time to resolve is a good start, but the real goal is to bring that number down.
Let’s be clear: lowering MTTR isn’t about cracking a whip and telling your team to “just work faster.” That’s a recipe for burnout and mistakes. The real win comes from systematically removing the friction and roadblocks that slow your incident response down. Think of it less like a frantic fire drill and more like a well-oiled, predictable system.
The strategies below aren’t just theory. They’re battle-tested approaches that bring clarity to chaos, improve collaboration, and give your engineers the confidence to find and fix problems efficiently.
Shore Up Your Processes First
Before you even think about new tools, take a hard look at your internal processes. This is where you’ll get the biggest bang for your buck. A clear, well-documented procedure is the foundation of any great incident response plan—it ensures everyone knows exactly what to do when the alarms start blaring.
Start with these three areas:
- Create Standardized Incident Playbooks: Your engineers shouldn’t have to figure things out from scratch in the middle of a crisis. Build out detailed playbooks for your most common incidents, like a database outage or a failing API. These guides should lay out the first diagnostic steps, who to notify, and how to escalate, turning a stressful guessing game into a simple checklist.
- Define Clear On-Call Schedules & Roles: Nothing kills your MTTR faster than confusion over who’s supposed to be handling an alert. A rock-solid on-call schedule with clearly defined responsibilities is non-negotiable. It makes sure every alert gets seen and acted on immediately, so nothing falls through the cracks.
- Run Blameless Post-Mortems: The work isn’t done just because the incident is over. A blameless post-mortem is crucial for learning. The focus should always be on “what can we improve in the system?” not “who made a mistake?” This creates a safe space for honest conversation and helps you identify real, actionable steps to prevent the same issue from ever happening again.
Key Insight: A culture that learns from failure is far more resilient than one that just demands speed. Blameless post-mortems turn every incident into a valuable lesson that makes your entire system stronger.
Get the Right Tools for the Job
Once your processes are solid, the right tools can be a massive advantage. They automate the tedious manual work and surface critical insights far faster than any human could. A well-chosen tech stack helps you spot problems earlier, diagnose them more accurately, and keep the response effort coordinated.
Think about tools that cover the entire incident lifecycle.
- Observability Platforms: Getting to the root cause fast is everything. Tools like Splunk, Datadog, or Honeycomb give you the deep visibility needed to do just that. They let engineers slice and dice logs, metrics, and traces to find the real source of the problem, not just symptoms.
- Automated Alerting: An alerting tool like PagerDuty is essential for any team that’s on call. It makes sure critical alerts get to the right person right away—via phone, SMS, or a push notification. This alone dramatically cuts down your Mean Time To Detect (MTTD) and Mean Time To Acknowledge (MTTA).
- A Central Communication Hub: Trying to manage an incident across DMs, emails, and random conversations is a nightmare. For every incident, spin up a dedicated Slack channel or a virtual “war room.” This keeps everyone—engineers, managers, support—on the same page and creates a clean, chronological record of everything that happened.
By pairing strong processes with smart tooling, you create a system that consistently drives down your mean time to resolve. It’s how you empower your team to handle incidents not just faster, but with more control and a whole lot less stress.
How AI Workflows Help Engineering Teams Lower MTTR

When we talk about mean time to resolve, our minds usually jump to catastrophic production outages. But the same principle applies to the daily grind of software development. Every single day is packed with “micro-incidents”—bugs that need squashing, tricky features to build, and technical hurdles to clear.
Each of these challenges has its own resolution time. The slow creep of these small delays can be just as harmful to productivity as one big system failure. This is where a new wave of AI-assisted workflows is making a real difference.
By weaving AI directly into the development environment, teams can slash the time it takes to get through these daily tasks. It’s like building up the “muscle memory” you need to handle high-stakes incidents with speed and confidence. This is why disciplines like AIOps are becoming so critical for modern engineering teams.
Gaining Unprecedented Visibility with AI Metrics
Let’s be honest: managers have historically had very little insight into what their developers are actually doing moment to moment. A developer could be stuck on the same problem all day, and you might not find out until the next standup meeting. That lack of real-time visibility is a massive source of hidden friction.
AI workflow managers like Zest flip this dynamic on its head. By observing how developers use AI coding assistants, these tools can provide hard data on where the real bottlenecks are.
- Spotting Stuck Time: Zest’s AI Metrics can automatically flag when a developer is spinning their wheels, letting a manager or senior dev step in to help before frustration takes over.
- Identifying Inefficient Patterns: Is the whole team struggling with a particular library or API? The data will show it, pointing you toward a clear need for better documentation or training.
- Understanding Tool Effectiveness: Are your developers actually getting value from their AI assistant? Or are they wasting time rewriting bad suggestions? AI Metrics give you the real story.
This level of detail turns the development process from a black box into a transparent, measurable system. It allows leaders to stop reacting to problems and start proactively optimizing their team’s workflow.
Key Insight: You can’t improve what you can’t measure. By bringing observability to the AI-assisted coding process, you can identify and eliminate the small, daily delays that quietly kill your team’s momentum and inflate your overall MTTR.
Using AI Hints as an Early Warning System
Even with the best dashboards, some problems are hard to see until hours have already been wasted. A developer might be feeding an AI assistant vague prompts or not giving it enough context, leading to a frustrating loop of bad suggestions and constant rework.
This is where AI Hints come in, acting as a powerful early warning system right inside the editor.
- Weak Prompt Detection: Zest can spot a generic prompt and suggest ways to make it more specific, which leads to much better AI-generated code.
- Context Gap Alerts: If a developer asks the AI to generate code without providing related files or function definitions, the system can nudge them to include that crucial context.
- Sideways Session Flags: AI Hints can tell when a coding session is going off the rails and suggest a different approach, pulling the developer out of a potential rabbit hole.
These automated nudges are like having an expert coach looking over your shoulder, offering advice at the exact moment you need it. They help engineers learn effective habits for working with AI on the fly, systematically chipping away at the resolution time for every single task.
Scaling Excellence with Shared Cheatcodes
On every engineering team, there are a few top performers who just get how to work with their tools. They know the perfect prompt to refactor a messy block of code or generate a full suite of unit tests. Too often, that knowledge stays locked in their heads.
AI workflow tools provide a way to capture those winning strategies and share them across the entire organization.
In Zest, these reusable, high-impact prompts are called cheatcodes. When a developer finds a great way to solve a common problem with AI, they can save that interaction as a cheatcode. Instantly, their winning formula is available to everyone on the team. By standardizing these best practices, you can elevate the performance of every single engineer.
This is exactly how elite IT ops teams use automation to their advantage. Those teams often crush their Mean Time to Remediate by using automated playbooks, sometimes cutting resolution time by as much as 33%. In the same way, sharing cheatcodes automates the spread of best practices, helping development teams resolve their daily coding “incidents” in minutes, not days. For more on this, check out our guide to improving productivity for developers.
Frequently Asked Questions About MTTR
Even after you’ve got the basics down, a few practical questions always pop up when you start tracking mean time to resolve in the real world. Let’s tackle some of the most common ones to help you put these concepts into practice.
What Is a Good MTTR Benchmark?
There’s no magic number here. A “good” MTTR is completely relative to your system and the incident’s impact.
For a critical production database that just went down, you might be aiming for a fix in under an hour. But for a minor UI bug that has a simple workaround? A resolution time of a few business days might be perfectly fine.
The best way to start is by measuring where you are right now to establish your own baseline. From there, the goal isn’t to hit some arbitrary industry number; it’s about making steady, measurable improvements over time.
How Should On-Hold Time Affect MTTR Calculations?
You absolutely have to exclude “on-hold” or “pending” time. This is any dead time where you’re stuck waiting for something outside your team’s control, like a customer response or a fix from a third-party vendor.
If you include this idle time, your MTTR will be artificially high, which completely hides how efficiently your team is actually working. Make sure your ticketing system is configured to automatically pause the clock when an issue is in one of these “waiting” states. This keeps your data clean and accurate.
Can Focusing Too Much on MTTR Be Harmful?
Yes, it definitely can. When reducing MTTR becomes the only thing that matters, it can lead to some really bad habits. Teams might feel pressured to slap a band-aid on a problem just to close the ticket quickly.
This kind of rushed work leads to sloppy code, new bugs, and a growing pile of technical debt. It also encourages engineers to dodge the big, complex problems in favor of scoring quick wins on easy fixes.
The key is balance. You need to look at MTTR alongside other important quality metrics, like Change Failure Rate (CFR) and customer satisfaction. This gives you a complete picture, ensuring you’re fixing things both quickly and correctly without mortgaging your system’s future for a little extra speed today.
How Can My Team Start Tracking MTTR Today?
You can probably get started with the tools you already have. Your current ticketing system—whether it’s Jira, GitHub Issues, or something similar—is the perfect place to begin.
Just create a simple, consistent process for logging when a bug or incident is created and when it’s resolved. Most of these platforms have built-in reporting that can calculate the average for you.
If you want to get more granular and look beyond just production incidents, newer tools can offer much deeper insights. For example, a platform like Zest can automatically track the time your developers spend on individual coding tasks and pinpoint slowdowns in their AI-assisted workflows. This gives you a kind of “development MTTR” without any manual effort, helping you speed up the countless small resolutions that happen every single day.
Bringing your mean time to resolve down isn’t a one-off project. It’s a habit you build—a constant cycle of tweaking your process, finding better tools, and creating a team culture that stays ahead of problems. The real shift happens when you move from frantic, reactive fire drills to a methodical approach that helps your team nail not just the big outages, but also the tiny, everyday fixes that make up modern software development.
Ultimately, the goal is to weave resilience and speed right into your engineering DNA. That way, every incident, big or small, becomes a genuine opportunity to get better. When you start tracking clear metrics, lean on standardized playbooks, and smartly integrate AI into your workflows, you can start knocking down the barriers that drag out your resolution times. This turns incident response from a major source of stress into a real competitive edge. It’s a win-win: your team’s morale gets a boost, you protect revenue, and you build unshakable trust with your customers. The key is using tools that give you a clear view of the entire development lifecycle, from the first line of AI-assisted code to the final deployment.
Master Your Mean Time To Resolve
Turn incident response from a reactive fire drill into a proactive engine for reliability and speed.
📊 Core Metrics
- Mean Time To Resolve (MTTR) — The total average time from an initial alert until the issue is fully fixed for users.
- Mean Time To Detect (MTTD) — How quickly your systems and team can identify that a problem exists.
- Mean Time To Acknowledge (MTTA) — The time it takes for an on-call engineer to start working on a triggered alert.
🕹️ My Cheatcodes
- 🌱 Standardize Playbooks — Create clear, repeatable steps for common incidents to eliminate guesswork during a crisis.
- 🦎 Run Blameless Post-Mortems — Focus on system improvements, not individual mistakes, to foster a culture of learning.
- ⚡ Use AI-Assisted Workflows — Leverage tools like Zest to gain visibility into daily coding tasks and share high-impact "cheatcodes."
📈 Reflection Points
- 💡 Are our incident definitions (start/end points) consistent across the team?
- 🧩 Is our on-call schedule clear and are roles well-defined to avoid confusion?
- 📘 Are we balancing the push for a lower MTTR with quality metrics like Change Failure Rate?
Gallery
Lemon shots



