
Mastering Mean Time to Resolution

When something breaks, how long does it really take your team to fix it? That’s the core question Mean Time to Resolution (MTTR) answers. It’s the average time from the initial report of an issue until it’s completely resolved and everything is back to normal for your users.
Think of it like a pit stop in a race. The timer starts the second a car pulls off the track and doesn’t stop until it’s fully serviced and speeding away again. This single metric offers a powerful glimpse into your team’s efficiency, the health of your systems, and, most importantly, the experience you’re delivering to customers.
What Exactly Is Mean Time to Resolution
At its heart, Mean Time to Resolution captures the entire lifecycle of an incident—from the first alert to the final all-clear. It’s not just about how quickly a developer can push a patch. Instead, it provides a complete picture of your entire response process.
A low MTTR is a great sign. It shows your team can quickly diagnose issues, work together effectively, and deploy fixes without a hitch. This translates directly into less downtime and happier users.
On the flip side, a high MTTR can be a red flag for deeper issues. It might point to clunky workflows, communication breakdowns between teams, or even just the wrong tools for the job. That’s why top-tier IT, DevOps, and support teams live and breathe this metric. It’s one of the most critical engineering performance indicators for measuring how resilient your systems—and your team—truly are.
The Five Stages of an Incident Lifecycle
To really get a handle on MTTR, you need to understand the journey an incident takes. The clock for Mean Time to Resolution is ticking through every single one of these phases.
- Detection: This is the starting line. An issue is first spotted, whether it’s from an automated monitoring alert or a customer support ticket. The MTTR clock officially begins now.
- Acknowledgement: Someone on the team picks up the baton. A person (or an automated system) acknowledges the alert and starts digging in. The problem goes from “known” to “being worked on.”
- Diagnosis: Here’s where the detective work happens. The team sifts through logs, runs tests, and collaborates to find the root cause. This is often the most time-consuming part of the whole process.
- Repair: With the cause identified, the team moves to implement the solution. This could mean deploying a hotfix, rolling back a recent change, or restarting a critical service.
- Resolution: The finish line. The team confirms the fix is working, the system is stable, and normal service has resumed for users. Only when the incident ticket is closed does the MTTR clock finally stop.
Breaking it down this way shows you why tracking Mean Time to Resolution is so valuable. It helps you pinpoint exactly where the friction is in your response pipeline, so you can make targeted improvements that actually move the needle.
How to Calculate Your MTTR Accurately
Before you can improve your MTTR, you have to know how to measure it. The good news is that the formula itself is pretty simple. The real challenge is getting clean, consistent data to plug into it. Let’s break down how to do it right.
At its core, the formula for MTTR is straightforward:
MTTR = Total Resolution Time for All Incidents ÷ Total Number of Incidents
You’ll typically calculate this over a set period—say, a week, a month, or a quarter. The “Total Resolution Time” is just the sum of the time it took to fix every single issue in that window, from the moment it was reported until it was officially closed out.
A Practical Calculation Example
Let’s see this in action. Imagine a development team tracked five bug fixes over a single work week. To figure out their weekly MTTR, they needed to be diligent about logging the start and end times for each one.
Here’s what their week looked like:
- Incident A (UI Glitch): Reported Monday @ 9:00 AM, Resolved Monday @ 11:30 AM. Total Time: 2.5 hours.
- Incident B (API Timeout): Reported Monday @ 3:00 PM, Resolved Tuesday @ 10:00 AM. Total Time: 19 hours.
- Incident C (Login Failure): Reported Wednesday @ 11:00 AM, Resolved Wednesday @ 12:00 PM. Total Time: 1 hour.
- Incident D (Database Lock): Reported Thursday @ 8:00 AM, Resolved Thursday @ 4:00 PM. Total Time: 8 hours.
- Incident E (Slow Page Load): Reported Friday @ 1:00 PM, Resolved Friday @ 2:30 PM. Total Time: 1.5 hours.
Once they have this data, the math is easy.
- Total Resolution Time: 2.5 + 19 + 1 + 8 + 1.5 = 32 hours
- Total Number of Incidents: 5
- MTTR: 32 hours ÷ 5 incidents = 6.4 hours
So, for that week, it took the team an average of 6.4 hours to resolve an issue. This number now serves as their baseline—a benchmark they can work to improve.
Common Pitfalls That Distort Your MTTR
While the formula is easy, a few common mistakes can completely throw off your numbers, making your mean time to resolution metric pretty useless. Watch out for these.
- Inconsistent Timestamps: When does the clock really start? Is it when an automated alert fires? When a customer support ticket is created? Or when an engineer actually acknowledges the issue? Your team has to agree on a single, clear starting point and stick to it.
- Forgetting to Close Tickets: The job isn’t done until the paperwork is. If an engineer pushes a fix but leaves the ticket lingering in the “in progress” column for days, you’re artificially inflating your resolution time and skewing the average.
- Ignoring “On-Hold” Time: What happens when you’re stuck waiting for a customer to reply or for a third-party vendor to do something on their end? Some teams pause the MTTR clock for these external dependencies, while others let it run. There’s no single right answer, but you absolutely must be consistent.
- Not Categorizing Incidents: A minor typo on the website is not the same as a full-blown system outage. If you lump every issue together, your MTTR becomes a meaningless average. Segmenting incidents by severity gives you a much clearer picture of what’s really going on.
This isn’t just an internal metric, either. MTTR has a direct and powerful impact on your customers. Research shows that 46% of customers expect a response within 4 hours, and 52% will stop buying from a company after bad service experiences.
Think about a food delivery company that resolved 150 customer complaints in a month with a total resolution time of 600 hours. Their MTTR was 4 hours—hitting that customer expectation right on the nose. Faster resolutions mean happier customers who stick around. For a deeper dive on this, check out the analysis on time to resolution at The CX Lead.
MTTR vs. Other Key ‘Mean Time’ Metrics
The world of incident management loves its acronyms, and it’s easy to get lost in the “alphabet soup” of MTTR, MTTD, MTTA, and MTBF. While Mean Time to Resolution is a fantastic measure of your repair process, it’s just one piece of a much larger puzzle.
To really understand your system’s health and your team’s effectiveness, you need to look at how these metrics work together. Let’s think of it like a fire breaking out in a data center.
- MTTD (Mean Time to Detect): This is the smoke alarm. It’s the time between the first spark and the moment an alarm bell rings. How quickly do you know a fire has started?
- MTTA (Mean Time to Acknowledge): The fire department gets the call. This is the time it takes for someone on your team to pick up the alert and say, “I’m on it.”
- MTTR (Mean Time to Resolution): The fire is out. This tracks the entire duration from detection to the moment the system is fully operational and the problem is completely solved.
Each metric shines a light on a different, crucial stage of handling an incident.
Mean Time to Detect (MTTD)
Mean Time to Detect is your first line of defense. It’s the clock that starts ticking the instant something goes wrong and stops the second your monitoring tools raise an alert.
A low MTTD is a sign of a healthy, observant system. It means you’re catching problems right away, before they have a chance to grow into full-blown crises. If your MTTD is high, it’s a red flag that you have blind spots in your monitoring and issues are lurking undetected.
Mean Time to Acknowledge (MTTA)
Once an alert goes off, Mean Time to Acknowledge measures how long it takes for a human to respond. It’s a pure measure of your team’s readiness.
A short MTTA is a great sign. It shows your on-call process is smooth, alerts are getting to the right people, and your team is ready to jump into action. A consistently high MTTA might point to problems like alert fatigue (too many false alarms) or confusing escalation paths.
Mean Time Between Failures (MTBF)
Shifting gears from response to reliability, Mean Time Between Failures looks at the bigger picture. It measures the average uptime between one incident and the next. This isn’t about how fast you fix things; it’s about how long things stay fixed.
You’re always aiming for a high MTBF. A long time between failures means your system is stable and robust. If you see this number starting to shrink, it’s a warning that underlying issues might be making your services more fragile.
This infographic breaks down the simple math behind Mean Time to Resolution. It’s the total time spent resolving all incidents, divided by the number of incidents.
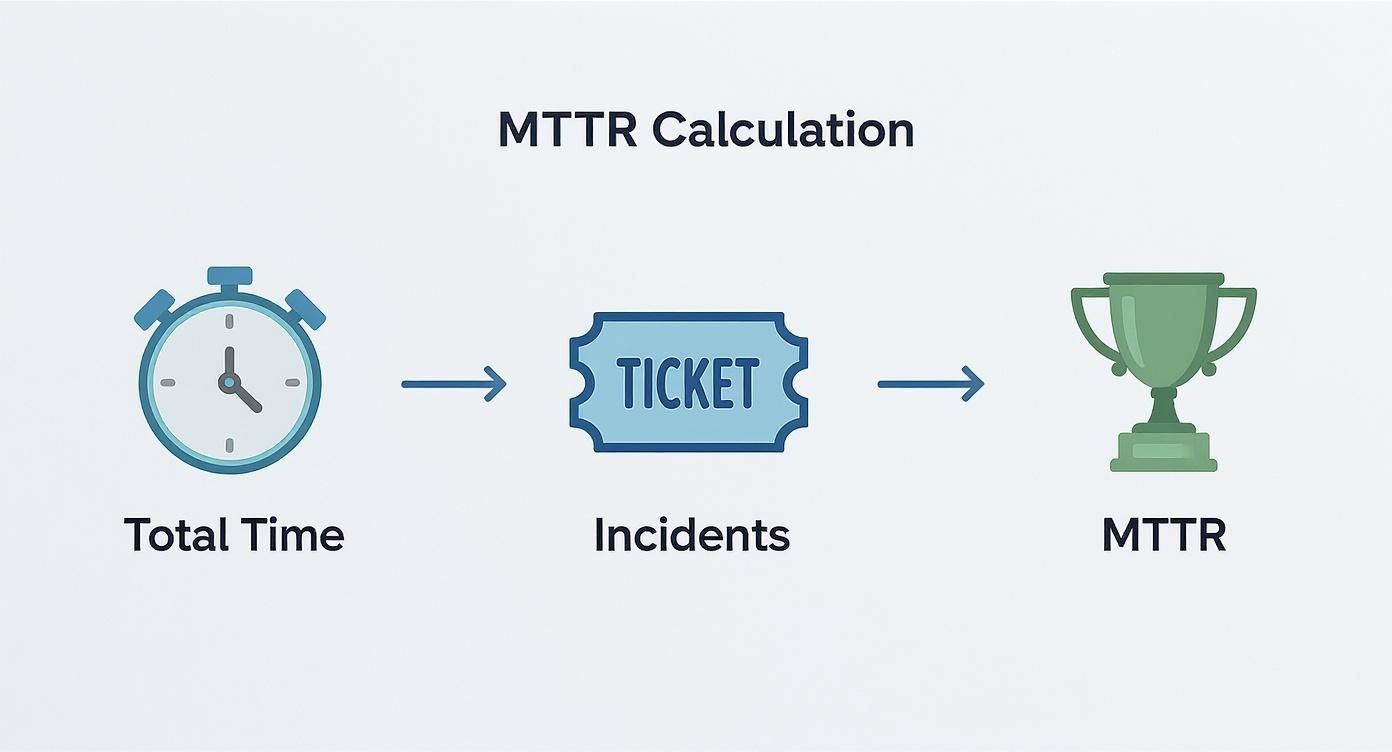
This highlights that MTTR is an average, making it a powerful way to benchmark your team’s efficiency and track improvements over time.
Putting It All Together
These metrics aren’t rivals; they’re teammates. They give you a complete, 360-degree view of your operational health. Together, they are fundamental components of elite engineering performance, often discussed in frameworks like the DORA metrics.
You could have the fastest pit crew in the world (low MTTR), but if your smoke detectors are off (high MTTD), the building will still suffer massive damage before your team even knows there’s a problem.
Here’s a quick reference to keep these straight:
Comparison of Key ‘Mean Time’ Metrics
The table below breaks down these four critical metrics, clarifying what each one measures and why it matters.
| Metric | What It Measures | Primary Goal | Example |
|---|---|---|---|
| MTTD | How long it takes to find an issue. | Improve monitoring & observability. | The time from a database spike to an alert firing. |
| MTTA | How long it takes to start working on an issue. | Increase team responsiveness. | The time from an alert firing to an engineer being assigned. |
| MTTR | How long it takes to fully resolve an issue. | Improve repair processes & efficiency. | The total time from alert to the deployment of a hotfix. |
| MTBF | The average time between failures. | Increase overall system reliability. | The number of days a service runs without an outage. |
By tracking all of these “Mean Time” metrics, you move beyond just putting out fires. You start building a more resilient, efficient, and predictable operation.
Alright, so you’ve got your MTTR number. Now what? Is it any good?
The honest, and sometimes frustrating, answer is: it depends. There’s no magic number for a “good” MTTR that works for every company, team, or incident.
Trying to hit some generic industry average can send you down the wrong path. A solid mean time to resolution is all about context. It’s shaped by your industry, how critical the service is, and the sheer complexity of the problem you’re trying to solve.
It All Comes Down to Context
Think of it like this: if the payment gateway on an e-commerce site goes down on Black Friday, that’s an all-hands-on-deck emergency. You need a fix in minutes, maybe even seconds. An MTTR of even one hour in that situation would be a disaster.
But what about a minor display bug on an internal admin panel that only a handful of people use? It’s not nearly as urgent. Taking a few business days to resolve it might be perfectly fine, letting the engineering team stay focused on bigger priorities.
A “good” MTTR isn’t a static number you pull from a report. It’s a moving target that reflects your business goals and what your customers expect. The best benchmark is your own trend over time—are you getting faster?
Using Industry Benchmarks as a Reality Check
While your own historical data is the most important yardstick, looking at industry figures can give you a general sense of where you stand. It helps you see the bigger picture and understand the typical performance range.
For example, global data shows the average MTTR for desktop IT support incidents is around 8.85 business hours. But that average hides a massive spread, with some simple fixes taking less than an hour and complex ones stretching to nearly 28 hours. This just goes to show how much things like incident complexity and team structure can move the needle. You can dig into these MTTR findings on Kayako’s blog for more detail.
To give you a rough idea, here are some common benchmarks you might see:
- SaaS and Tech: For a P1 incident like a full application outage, top-tier teams often shoot for an MTTR of under 1 hour. For less severe issues, a target of 4-8 hours is common.
- E-commerce: Anything that breaks the checkout flow is a code-red alert. Teams often have aggressive MTTR goals here, sometimes as low as 15-30 minutes.
- Cybersecurity: When a security breach happens, the clock is ticking. The focus is on containing the threat immediately. High-performing security teams aim to resolve major incidents in under an hour.
- Internal IT Support: For everyday employee issues that aren’t business-critical, an MTTR of 24-48 business hours is a pretty standard and reasonable goal.
Why Your Own Progress Is the Only Benchmark That Matters
Pitting your team against a tech giant is a recipe for frustration. It’s just not a fair or useful comparison.
A much better approach is to benchmark against yourself. First, get an accurate measure of your current MTTR, making sure to break it down by incident severity. This is your baseline.
From that point on, the goal is simple: continuous improvement. Is your MTTR for critical incidents trending downward month after month? That’s the true sign of a healthy, learning-focused incident response process. Focusing on your own progress helps you set achievable goals and celebrate real wins that actually make a difference for your users.
Proven Strategies to Reduce Your MTTR

Knowing your MTTR is one thing. Actually lowering it is where the real work—and the real payoff—begins. A lower mean time to resolution isn’t just a metric for a dashboard; it means less downtime, happier customers, and more time for your team to build cool things instead of constantly putting out fires.
This isn’t about telling people to work faster or harder. It’s about working smarter by putting the right systems in place. When you combine solid technical solutions with a culture of learning, you can methodically chip away at your resolution times.
Enhance Your Monitoring and Alerting
You can’t fix a problem you don’t know exists. The race to a low MTTR often begins by shrinking your Mean Time to Detect (MTTD). If it takes you hours just to realize something is wrong, you’ve already lost the battle.
This is where strong observability comes in. We’re talking about more than just a simple server “ping” check. You need to instrument your applications to get rich, contextual data on how they’re performing. When an alert does go off, it needs to be immediately actionable. A great alert tells you exactly what’s broken, where it’s broken, and how bad the damage is, giving your team a massive head start.
Standardize Everything with Runbooks and Playbooks
When an incident hits at 3 a.m., the last thing you want is your on-call engineer fumbling around, trying to remember what to do. This is why standardized response plans, often called runbooks or playbooks, are a game-changer. They bring calm and consistency to a chaotic situation.
A good runbook is a simple, step-by-step guide for handling a specific issue. It should answer all the crucial questions upfront:
- Who is the point person for this service right now?
- What are the first three things I should check?
- Where are the dashboards and logs I need?
- Who do I escalate to if I’m stuck?
Documenting these procedures takes the guesswork out of a crisis, which means even junior team members can step in and contribute effectively. This discipline also has a great side effect: it helps in reducing technical debt by making your systems easier to understand and manage over time. For more on this, check out our guide on how to start reducing technical debt.
Embrace Automation for Diagnostics and Remediation
So many of the first steps in troubleshooting are repetitive: running diagnostic scripts, pulling logs from three different places, restarting a service. These are prime candidates for automation. When you automate these routine tasks, you let your engineers jump straight to the hard part: figuring out the root cause.
The goal of automation isn’t to replace engineers, but to empower them. By handling the rote tasks, automation acts as a force multiplier, allowing a small team to manage a large, complex system efficiently.
This is especially true in cybersecurity, where every second counts. MTTR is a direct measure of a security team’s effectiveness. You’ll find that enterprises with dedicated security teams often achieve 30-40% faster MTTR than their peers, largely because they invest heavily in automated tools for threat detection and response. To see how these ideas apply in security, you can learn more about incident response effectiveness on plurilock.com.
Foster a Culture of Blameless Post-Mortems
Every outage is a learning opportunity. After an incident is resolved, a blameless post-mortem is your chance to dissect what happened, what went right, and where you can improve. The golden rule here is to focus on the process and the system, not on pointing fingers at individuals.
When people feel safe to speak up, you get honest feedback that uncovers the real root causes. Was the documentation out of date? Was the alert confusing? Was the on-call schedule unclear? The answers to these questions are what lead to real, lasting improvements to your mean time to resolution.
A post-mortem isn’t finished until you have a list of action items. These aren’t just vague suggestions; they are concrete tasks assigned to specific people with deadlines, ensuring that the lessons you just learned actually prevent the next incident.
Frequently Asked Questions About MTTR
Once a team decides to get serious about mean time to resolution, the questions start flying. And they’re good questions—the kind that can stop progress in its tracks if you don’t have clear answers. Getting the nuances right is the key to making MTTR tracking fair, consistent, and actually useful.
Let’s tackle some of the most common ones.
Should We Pause the MTTR Clock for External Dependencies?
This is the classic debate. What do you do when you’re stuck waiting on a customer for more info or a third-party vendor to fix their API?
The short answer: don’t stop the main MTTR clock. From the customer’s point of view, the problem isn’t solved. They don’t care who’s holding things up; they just know their issue is still open. The total time from their first report to the final fix is their reality, and your MTTR should reflect that.
But that doesn’t mean you can’t get more granular. It’s smart to track that “on-hold” or “pending” time as a separate metric. This gives you two powerful data points: the full customer-facing MTTR and your team’s internal efficiency. If you find that a huge chunk of your resolution time is just waiting around, you’ve just uncovered a great opportunity to improve your customer communication or get tougher with your vendors.
How Do We Set Different MTTR Goals for Different Issues?
Applying a single MTTR target to every single incident is a recipe for useless data. A minor typo on the marketing site is not the same as a full-blown production database failure. They demand completely different responses, and they should have completely different goals.
The best way to handle this is to categorize incidents by their severity. A simple P1-P4 scale is a great place to start:
- P1 (Critical): Think major outages, data breaches, or core functionality being completely broken. The goal here should be aggressive—often under 1 hour.
- P2 (High): A key feature is failing for a lot of users, but there might be a temporary workaround. A target MTTR of 4-8 hours is a solid goal.
- P3 (Medium): You’re looking at minor bugs or issues that impact a small subset of users. An MTTR of 24-48 business hours is usually perfectly fine.
- P4 (Low): These are the cosmetic fixes or tiny annoyances. An MTTR target might be several days, or you might just roll the fix into the next planned sprint.
Setting tiered goals like this makes sure your team’s sense of urgency is directed where it truly matters.
What Are the Best Tools for Tracking MTTR Automatically?
Trying to track MTTR in a spreadsheet is a noble effort, but it’s error-prone and just doesn’t scale. You need tools that plug right into the workflows your team already uses.
Here’s where to look:
- IT Service Management (ITSM) Platforms: Tools like Jira Service Management, ServiceNow, and Zendesk are literally built for this. They automatically timestamp everything from the moment a ticket is created to when it’s closed, making MTTR reports a breeze.
- Incident Management Tools: If you’re dealing with on-call rotations, platforms like PagerDuty or Opsgenie are your best friends. They track the entire incident lifecycle automatically and give you deep analytics on MTTR, MTTA, and other key metrics.
- Observability and APM Tools: Why wait for a user to report a problem? Solutions like Datadog or New Relic can spot issues the moment they happen, giving you an automated, accurate starting point for your MTTR clock.
The goal is simple: find a tool that captures your start and end times without anyone having to think about it. That’s how you get data you can trust.
Ready to slash your team’s resolution time? It starts with understanding and improving your AI-assisted coding workflows. Zest gives you the visibility to see what’s working, share effective habits, and help every developer perform like your best. See how it works at https://meetzest.com.
Master Your MTTR Workflow
Use these insights to refine your incident response process and consistently drive down resolution times.
📊 Key Metrics
- MTTR by Severity — Your average fix time broken down by P1, P2, P3, etc., to see if you're hitting critical targets.
- "On-Hold" Percentage — The slice of your resolution time spent waiting for customers or vendors.
- First Contact Resolution (FCR) Rate — The percentage of problems you solve in the very first interaction.
🕹️ My Cheatcodes
- 🌱 Tier Your Goals — Never use a one-size-fits-all MTTR target. Set different goals for critical, high, and low-priority issues.
- 🧭 Track, Don't Stop — Measure "on-hold" time separately, but keep the main MTTR clock running to stay true to the customer's experience.
- ⚡ Automate Everything — Use tools like Jira or PagerDuty to log timestamps automatically. Manual tracking is a recipe for bad data.
📈 Reflection Points
- 💡 When we say an issue is "resolved," does our customer agree?
- 🧩 Are we spending more time waiting on others than we are actually fixing things?
- 📘 Can I trust my tools to give me one single, accurate source of truth for incident timestamps?
Gallery
Lemon shots



