Lead Time Software to Speed Up Your Engineering Cycles

Lead time software gives you a crystal-clear, data-driven look into your entire development pipeline, all the way from the first commit to final deployment. It answers a simple but vital question: How long does it take for an idea to become a live feature in the hands of our users? By measuring this, engineering teams can finally pinpoint the hidden bottlenecks and start shipping value, faster.
Understanding Lead Time and Why It Matters

Think of a busy restaurant. When a customer places an order, a whole process kicks off. The ticket hits the kitchen, ingredients are prepped, the dish is cooked, plated, and finally carried out to the table. That entire span of time—from the moment the order was placed to the moment the food arrives—is the lead time.
Software development works in a surprisingly similar way. When a developer commits new code, it’s like the kitchen getting an order. That code then has to be reviewed, tested, merged, and deployed before it ever reaches your “customer”—the end-user. Lead time is the metric that tracks this entire journey.
The True Cost of Long Lead Times
A long lead time isn’t just a simple delay. It’s a red flag, a symptom of deeper problems in your workflow. It signals that friction and bottlenecks are slowing down the delivery of value. These delays directly hurt your ability to react to market shifts, squash critical bugs, and ship the features your customers are clamoring for.
So, what are the usual suspects behind inflated lead times?
- Slow code reviews: Pull requests just sit there, gathering dust for days.
- Flaky testing environments: Manual or unreliable tests bring everything to a halt.
- Complex deployments: Manual, multi-step procedures that are prone to error.
- Silos and poor communication: Handoffs between dev, QA, and ops teams are clunky and slow.
Tracking lead time isn’t about breathing down developers’ necks to code faster. It’s about making those invisible roadblocks impossible to ignore. Good lead time software arms your teams with the data they need to have honest, productive conversations about improving their shared process.
Lead Time vs. Cycle Time: The Critical Difference
People often use the terms “lead time” and “cycle time” interchangeably, but they measure two very different parts of the development process. Mixing them up can send you chasing solutions for the wrong problem.
Cycle time is a subset of lead time. It tracks the time when a developer is actively working on a task—from their first commit to when the pull request is ready. Lead time, on the other hand, measures the whole shebang, including all the waiting and handoffs in between.
If your lead time is long but your cycle time is short, you have a huge clue. It means your developers are working efficiently, but the system around them—like code reviews or deployment queues—is the real bottleneck. We cover this in more detail in our guide to the cycle time definition.
To help clarify, here’s a quick breakdown of the two metrics.
Lead Time vs. Cycle Time at a Glance
| Metric | Starts When… | Ends When… | Measures… |
|---|---|---|---|
| Lead Time | An idea is accepted or a ticket is created. | The feature is live in production for users. | The entire value delivery pipeline, including all wait times. |
| Cycle Time | A developer makes the first code commit. | The work is merged and ready for deployment. | The “active development” phase of the process. |
This distinction is crucial because elite teams obsess over optimizing their entire value stream, not just the coding part.
The median lead time for high-performing software teams is now around 1 hour, with some organizations deploying in under 10 minutes. According to recent software development trends, a 2025 survey found that organizations using CI/CD pipelines cut their lead time by up to 70% compared to those still relying on manual processes. The gap is widening, and it all starts with measuring the right thing.
What to Look For in Good Lead Time Software
Picking the right lead time software isn’t about ticking off the most features. It’s about finding a tool that gives you clarity, not just a mountain of data. The best tools don’t just spit out numbers; they tell you the story behind those numbers, showing you exactly why things are slowing down so your team can actually fix the root cause.
After all, a great platform doesn’t just tell you your lead time is ten days. It shows you that eight of those days were spent waiting for a code review. That’s the real difference between a basic reporting tool and a partner in improving your process.
It All Starts with Effortless Data Integration
The bedrock of any useful lead time tool is how well it plugs into the tools your team already uses every day. If you have to manually enter data, forget it. It’s a recipe for inaccurate information, wasted time, and a process that no one will stick with.
This means you absolutely need a tool with deep, native integrations for:
- Your Code Repositories: It has to connect directly to GitHub, GitLab, or Bitbucket to automatically pull in all the crucial data from commits, branches, and pull requests.
- Your CI/CD Pipeline: It needs to link up with tools like Jenkins, CircleCI, or GitHub Actions to track how long builds, tests, and deployments are taking.
- Your Project Management Hub: It must sync with something like Jira or Asana to connect all the engineering activity back to the actual tickets, epics, and business goals.
Without this automatic data pipeline, you’re flying blind. Your metrics will always be spotty and out of date. Seamless integration is non-negotiable—it ensures your data is real-time, accurate, and doesn’t add a single bit of overhead for your developers.
Dashboards and Visuals That Actually Tell a Story
Nobody wants to stare at a spreadsheet. Raw data is overwhelming and often does a great job of hiding the exact trends you’re trying to spot. This is why great lead time software is built around powerful, intuitive visualizations. One look at a well-designed dashboard should give you an immediate gut-check on the health of your team’s workflow.
Look for a tool that lets you build your own dashboards to track the metrics that matter to your team. This is definitely not a one-size-fits-all scenario. Your platform team might be obsessed with pipeline stability, while your product team is laser-focused on how fast features get to customers.
Good software lets you build the view you need. It should allow you to filter data by team, project, repository, or even specific feature tags, turning a sea of information into actionable insights.
This kind of flexibility lets you compare performance over time, spot outliers, and celebrate wins in a way that’s meaningful to everyone involved.
Pinpoint the Exact Bottlenecks
Here’s where the magic really happens. The most powerful lead time tools act like a diagnostic MRI for your entire development process. They dissect the total lead time into its distinct phases, showing you precisely where work is getting stuck. This is the difference between knowing you’re slow and knowing why you’re slow.
A must-have capability is breaking the process down into its key stages:
- Time to First Commit: How long does a ticket sit on the backlog before a developer starts coding?
- Coding Time: How much time is spent in active development?
- Pull Request Wait Time: This is a big one. How long does a PR sit idle before someone even looks at it?
- Review to Merge Time: Once a review starts, how long does the back-and-forth take before the code is merged?
- Deployment Time: From merge to production, how fast are you shipping?
When your software can clearly show you that 80% of your lead time is eaten up by PRs waiting for a review, you’ve found your smoking gun. You now have a clear, data-backed problem to solve. This granular view shifts conversations from “I feel like…” to “The data shows that…”, which is exactly what you need for genuine, collaborative improvement.
How to Actually Measure and Analyze Your Lead Time
Getting the data is easy. The hard part is knowing what to do with it. Good lead time software doesn’t just spit out a single, generic number. It helps you break down the entire development process, turning a bunch of raw metrics into a clear story about how your team works and where things are getting stuck.
Just looking at an “average” lead time is a trap. An average of five days could mean half your tasks ship in one day and the other half get stuck for nine. That’s why modern tools have moved past simple averages. Scatterplots are your friend here—they show you the real distribution of your work, making it impossible to ignore those painful outliers that kill your team’s momentum.
This is how you move from just talking about improvement to actually doing it.
The image below gives you a sense of this workflow in action.
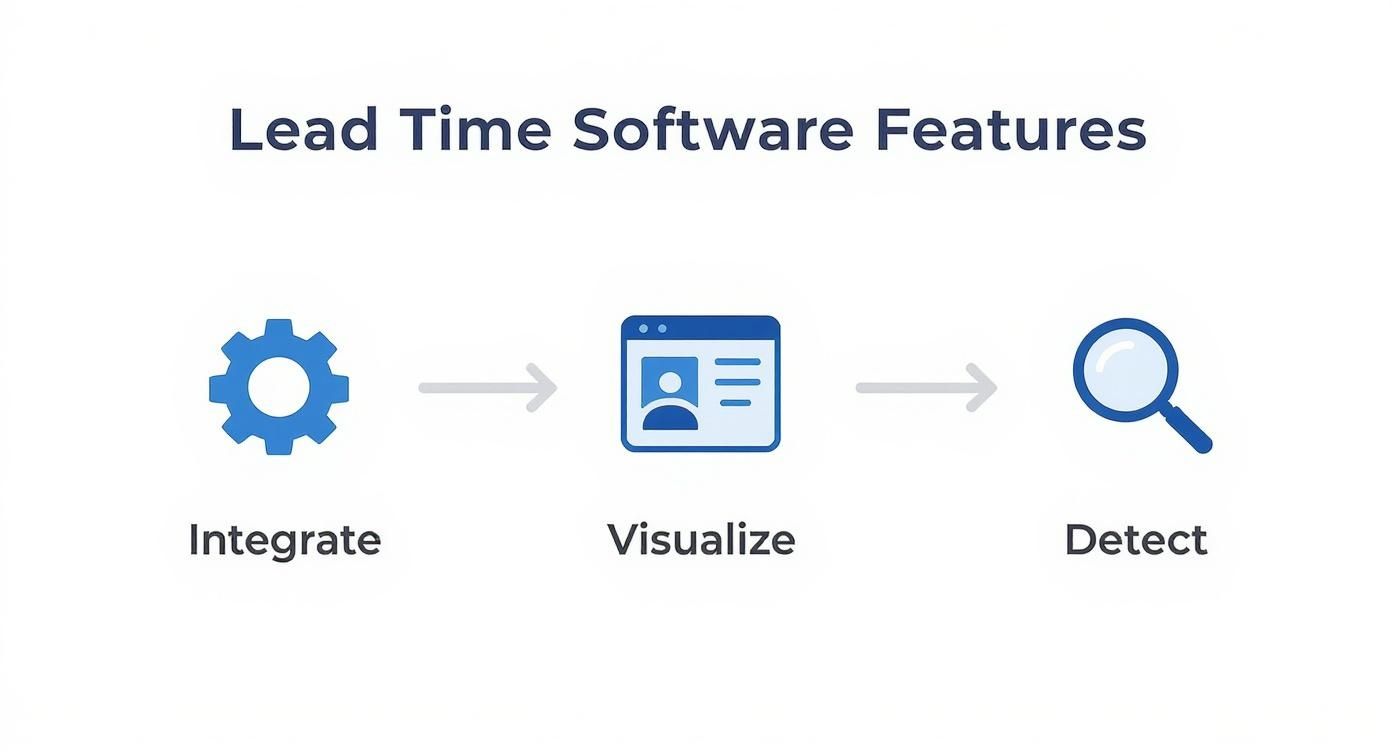
It all starts with pulling in the data, then visualizing it in a way that makes sense, and finally spotting the patterns that tell you where to focus your energy.
Deconstructing Your Lead Time into Core Phases
The real magic of good lead time software is its ability to slice the total time into smaller, more manageable pieces. This granular view is where you find the smoking gun—the exact stage where work is piling up. By looking at each phase separately, you can stop guessing and start fixing the real problem.
Here are the key parts you should be tracking:
- Time to Open (PR): How long does it take from the first commit to when a pull request is actually created? If this is high, it could mean developers are tackling features that are too big or the requirements aren’t clear enough.
- Time to First Review: This is the dead time between a PR being opened and a teammate leaving the first comment. A high number here is a massive red flag that your review process is a bottleneck.
- Time to Merge: This tracks the active review cycle, from that first comment until the PR is merged. Long merge times often point to overly complex code, a ton of back-and-forth, or no clear owner to make the final call.
- Time to Deploy: This is the final step, measuring the time from merge to the code going live in production. Delays here usually mean something is wrong with your CI/CD pipeline, like slow tests or manual deployment steps.
When you measure each of these phases, you stop having vague conversations like “our lead time is too long” and start having productive ones like, “our pull requests are sitting for an average of 48 hours before anyone even looks at them.”
This is what makes team retrospectives useful. Instead of arguing over opinions, everyone can look at the data, agree on the problem, and brainstorm specific solutions.
Connecting Lead Time to Elite Engineering Performance
Measuring lead time isn’t just a random exercise; it’s one of the most important things you can do to build a high-performing team. Lead time is one of the four key DORA metrics, a framework developed to figure out what elite engineering organizations do differently. The other three—Deployment Frequency, Change Failure Rate, and Mean Time to Recovery—are all tied to lead time. For example, a shorter lead time naturally allows you to deploy more often.
You can dive deeper into this framework in our complete guide on what DORA metrics are. When you start analyzing lead time regularly, you give your team a powerful tool for continuous improvement. It builds a shared understanding of what you’re capable of delivering and creates a culture where data is used to learn and get better, not to point fingers.
Proven Strategies to Reduce Your Lead Time
So, you’ve got lead time software set up, and it’s showing you where the logjams are. That’s the first step. But data without action is just noise. The real magic happens when you use those insights to clear the path from a developer’s keyboard to a happy customer.
This is where the best engineering teams really shine. They don’t just measure delays; they hunt them down and eliminate them. It’s about turning diagnostics into a repeatable cycle of improvement that makes your entire delivery process smoother and faster.
Optimize Your Code Review Process
Nine times out of ten, one of the first and biggest bottlenecks your software will flag is the code review stage. Pull requests (PRs) can feel like they’ve been sent into a black hole, sitting idle for days or getting tangled in an endless back-and-forth. This is a massive, and fixable, source of delay.
A great place to start is by setting up automated alerts for “stale” PRs. Your software can easily ping a channel when a pull request has been open for more than 24 hours without a single comment. This one simple change can be a game-changer for your “Time to First Review” metric, creating a team-wide habit of giving prompt feedback.
Beyond that, use the data to make a case for smaller, more frequent commits. We’ve all been there—staring down a massive, monolithic PR that’s a nightmare to review. By showing your team that PRs under 200 lines of code get merged 50% faster than the behemoths, you encourage a culture of atomic changes. These are not only easier to review but also simpler to test and safer to deploy.
A code review shouldn’t be a gate. Think of it as a collaborative checkpoint. When you set clear team expectations, like a 24-hour turnaround for an initial review, the whole process shifts from a bottleneck to something that actually boosts quality and speed.
Speed Up Your CI/CD Pipeline
The next big culprit is almost always the continuous integration and continuous delivery (CI/CD) pipeline. Your code review could be lightning-fast, but if a slow, flaky testing and deployment process is waiting at the end, you’re still stuck.
Your lead time software will pinpoint exactly where the pipeline is dragging its feet. You might discover, for instance, that a particular suite of integration tests takes a whopping 45 minutes to run, holding up every single deployment.
Once you know where the problem is, you can start fixing it:
- Parallelize Slow Tests: Instead of running tests one after another, restructure your pipeline to run multiple suites at the same time.
- Identify and Refactor Flaky Tests: Those tests that fail randomly are toxic. They kill developer momentum and destroy trust in your pipeline. Find them, fix them, or get rid of them.
- Optimize Build Times: Look for easy wins like caching dependencies or streamlining build steps. Shaving even a few minutes off every run adds up fast.
Fixing your pipeline doesn’t just cut down your “Time to Deploy.” It’s also a crucial part of managing your system’s overall health. For a closer look, we have a whole guide on best practices for reducing technical debt that keeps your systems running smoothly.
Create More Accurate Delivery Forecasts
Nothing erodes trust faster than constantly missing deadlines. It stresses out the team and leaves stakeholders frustrated. This is where lead time software can have a profound impact—by helping you move from gut-feel estimates to data-driven forecasting.
Instead of guessing, you can use scatterplot diagrams of your historical lead times to make probabilistic forecasts. This means you can confidently say things like, “Based on our last 50 features of this size, there’s an 85% chance we’ll deliver this in 12 days or less.”
This approach does two amazing things. First, it sets realistic expectations with everyone outside of engineering. Second, it empowers your team to have honest conversations about scope. If a deadline looks impossible based on the data, you can show why and have a productive discussion about what needs to change to hit the target.
Suddenly, planning meetings transform from tense negotiations into collaborative, data-informed strategy sessions. You build a foundation of trust and predictability that benefits everyone.
Common Bottlenecks and Software-Driven Solutions
To put it all together, let’s look at some of the most common issues and how software-driven insights can lead to practical solutions. Think of this as a quick-start guide to turning your data into real-world improvements.
| Common Bottleneck | How Software Identifies It | Actionable Strategy |
|---|---|---|
| Stale Pull Requests | High “Time to First Review” metric; PRs aging over 24 hours. | Set up automated alerts for idle PRs and establish team review norms. |
| Endless Review Cycles | High “Time to Merge” metric after the first comment. | Encourage smaller, atomic PRs; implement clearer contribution guidelines. |
| Slow Build and Test | High “Time to Deploy” metric; long CI pipeline run times. | Analyze CI logs to find slow tests and run them in parallel. |
| Unpredictable Delivery | Wide variance in lead times shown on a scatterplot. | Use historical lead time distribution to create probabilistic forecasts. |
By systematically identifying these bottlenecks and applying targeted strategies, you can create a workflow that is not only faster but also more predictable and less stressful for your team.
Rolling Out Lead Time Software Without the Friction

Let’s be honest: introducing any new measurement tool can make a team nervous. If you don’t handle it with care, it can feel like a threat. The secret to a smooth rollout of lead time software isn’t about the tech—it’s about the people. Success hinges on making it clear this is a tool for team empowerment, not top-down surveillance.
The moment developers hear “metrics,” many instinctively brace for unfair judgment or comparisons. Your first job is to get ahead of that fear. The point isn’t to track individual stats; it’s to uncover and fix the systemic bottlenecks that make everyone’s work more difficult. This software is a flashlight for spotting process snags, not a magnifying glass for scrutinizing people.
Start with a Pilot Team to Build Momentum
Forget the big-bang, company-wide launch. Just start small. Pick a single team that’s enthusiastic, open to trying new things, and willing to give you straight-up feedback. This small-scale approach turns the rollout into a collaborative experiment instead of a mandate from above.
Your pilot team is now your internal case study. When they use the software to spot a real bottleneck—say, a sluggish code review process—and then actually fix it, they become your most powerful advocates. Their success story, told in their own words, is worth more than a dozen management presentations. These internal champions are absolutely vital for getting other teams to buy in organically.
Frame the initial rollout as an experiment. Tell the team, “Let’s learn together how this data can help us hit our goals, like making our workflow more predictable or cutting down the time we spend waiting on others.”
This human-first approach can transform a potentially tense change into a shared journey of getting better, together.
From Technical Integration to Cultural Adoption
Getting the software hooked up to Git, Jira, and your CI/CD pipeline is the easy part. The real work is integrating it into your culture. That takes a deliberate communication plan built on transparency and trust.
Here’s a simple playbook for growing a healthy, data-informed culture:
- Be Open About the ‘Why’: Make it crystal clear the goal is to improve the system, not to micromanage individuals. Reassure everyone that the data will be used to help the team, not punish it.
- Use Data to Celebrate Wins: The very first thing you should do with your new insights is find a win. Show how a process change led to a measurable drop in lead time and celebrate that success publicly. This builds a positive connection to the metrics from day one.
- Make It Collaborative: Don’t just show dashboards; bring the data into team retrospectives. Ask open-ended questions like, “The data suggests our PRs are waiting a while for review. What do you all think is going on there?” This invites the team to own both the problem and the solution.
This whole push to shorten development cycles is part of a much larger trend. For instance, experts estimate that by 2025, a staggering 70% of new applications will be built using low-code or no-code tools—a massive leap from just 25% in 2020—all in the name of delivering faster. As you can learn more from software development statistics, the drive to shrink lead time is everywhere. By adopting lead time software as a team, you make sure it becomes a valued part of your toolkit, not just another ignored dashboard.
The Business Impact of a Shorter Lead Time
Let’s be clear: focusing on your engineering team’s lead time isn’t just a technical exercise. It’s a core business strategy. When you shrink the time it takes to get code from a developer’s keyboard to your customers, it sends ripples across the entire company. You’re not just making engineers faster; you’re building a real competitive advantage.
Think about it. This speed directly translates to a faster time-to-market. Instead of features being stuck in a pipeline for months, you can deliver real value to users in weeks, sometimes even days. This kind of agility means you can pivot on a dime, responding to customer feedback and market shifts almost in real-time. Your engineering team becomes less of a feature factory and more of an engine for innovation.
Fueling Growth and Innovation
A smooth, predictable development process does more than just ship code. It has a massive, often underestimated, impact on customer happiness and the well-being of your own team.
- Happier Customers: When you can fix bugs and roll out requested features quickly, customers feel heard. That responsiveness builds loyalty and keeps them from looking elsewhere.
- Better Developer Morale: Nothing burns out a great developer faster than seeing their work get stuck in endless reviews or deployment queues. When code ships smoothly, they see the impact of their efforts, feel more engaged, and are more likely to stick around.
- Smarter Business Decisions: Predictable delivery times mean you can actually trust your forecasts. This allows leaders to plan product roadmaps, align marketing campaigns, and make strategic bets with a lot more confidence.
Ultimately, shortening your lead time creates a powerful feedback loop. Faster delivery gets you feedback from the market sooner. That feedback helps you build better, smarter products, which in turn drives business growth. It’s about tying engineering work directly to what matters most.
So, bringing in a tool to measure and improve lead time isn’t just about tweaking engineering efficiency. It’s about building a more nimble, innovative, and competitive business from the ground up.
Got Questions About Lead Time Software? We’ve Got Answers.
Jumping into any new tool, especially one that measures how you work, is bound to bring up some questions. It’s smart to be skeptical. Let’s tackle the most common concerns engineering teams have when they first start exploring lead time software.
How Much of a Headache Is the Initial Setup?
This is usually the first thing people ask, and for good reason. Nobody wants a tool that takes weeks to configure and becomes a part-time job to maintain.
Thankfully, modern tools are built to plug right into your existing workflow. The setup is mostly about connecting to your tools via standard APIs—think granting access to GitHub or GitLab, your Jira board, and your CI/CD pipeline. For most teams, the technical part is done in under an hour.
The real work isn’t about code; it’s about getting your team on the same page about how you’ll interpret and use the data you’re about to see.
Is This Just Another Way to Track Individual Developers?
This is the big one. And the answer has to be an emphatic NO. If a tool is used to monitor or rank individuals, it’s not only being used wrong—it’s actively harming your team.
The entire point of lead time software is to see the health of the system, not to judge the people in it. It’s designed to shine a light on process problems, like a code review step that consistently takes days or a testing environment that’s always flaky.
Think of it this way: you’re not asking, “Who is the slowest coder?” You’re asking, “Where is our work getting stuck?” When you frame it as a tool for removing shared frustrations, you build trust. Otherwise, you just create a culture of fear.
Using these metrics for performance reviews is the fastest way to kill morale and make your metrics completely useless. The focus must always, always be on improving the process together.
Our Workflow Is a Mess. Can Handle That?
Let’s be honest, almost no team has a perfectly linear, “to-do -> in-progress -> done” workflow. Real-world development is messy. A feature gets put on hold, a critical bug jumps the queue, or you’re blocked waiting on another team. A good tool has to account for that reality.
Here’s how they typically do it:
- Syncs with Your Project Board: By connecting to something like Jira, the software can see ticket statuses. It knows when a task is marked “Blocked” or “On Hold” and can exclude that time from active development metrics.
- Lets You Map Your Process: You should be able to configure the tool to understand your team’s unique language. For instance, you can tell it to recognize a “do not merge” label on a pull request and treat that time differently.
- Filters Out the Noise: You can slice and dice the data to compare apples to apples. You’d expect the lead time for a small bug fix to be much shorter than for a brand-new feature, right? Good software lets you analyze those work types separately to get a clear picture.
The bottom line is that the tool should adapt to how you work, not force you into some rigid, idealized process.
Optimize Your Engineering Cycles
Use data-driven insights to transform your development pipeline into a competitive advantage by shipping value faster and more predictably.
📊 Core Metrics
- PR Wait Time — Total time a pull request sits idle before the first review, a primary bottleneck indicator.
- Time to Deploy — Duration from code merge to production release, measuring CI/CD pipeline efficiency.
- Lead Time Variance — The distribution of your delivery times, revealing how predictable your workflow is.
🕹️ My Cheatcodes
- 🌱 System Over Self — Frame metrics as a tool to diagnose process health, not to judge individual performance.
- 🦎 Deconstruct to Diagnose — Break lead time into phases (coding, review, deploy) to find the exact source of delays.
- ⚡ Pilot to Persuade — Start with one willing team and let their success story drive organic adoption across the organization.
✅ Before You Begin
- 🔍 Integrate your Git repos, CI/CD pipeline, and project management tools.
- 📊 Identify your biggest bottleneck by analyzing each phase of your lead time.
- 🧭 Communicate the "why" to your team, focusing on shared improvement.
- 📈 Prepare to celebrate the first data-backed process win.
Gallery
Lemon shots