
Mastering Key Performance Indicators Engineering

So, what exactly are engineering Key Performance Indicators (KPIs)? At their core, they are specific, measurable metrics that help you track the performance and health of your development teams and processes.
But let’s be clear: these aren’t just numbers to fill a report. Think of them as a guidance system, helping your team see exactly how their day-to-day work connects to the bigger company-wide goals.
What Is KPI Engineering and Why It Matters
Let’s cut through the corporate-speak. KPI engineering isn’t about top-down oversight. It’s the practice of deliberately building a dashboard for your team’s journey.
Imagine a pilot flying a plane. They rely on instruments to know their altitude, speed, and direction, ensuring they get to their destination safely and on time. Your team needs the same thing—the right data to understand where you are, where you’re headed, and how to navigate the challenges along the way. This turns the vague idea of “performance” into a clear, measurable, and shared goal.
Without a solid set of KPIs, teams are often flying blind. They might be incredibly busy, churning out code and closing tickets, but have no real idea if any of it is actually making a difference. Are we shipping code faster only to introduce more bugs? Are we building features that customers even want?

Connecting Daily Work to Business Goals
The real magic of engineering KPIs is how they create a direct line of sight between the code your team writes and the success of the business. It’s all about answering the “why” behind the work. When you get them right, these metrics create powerful feedback loops that spark continuous improvement.
This intentional approach to measurement helps your team:
- Spotlight Bottlenecks: Easily identify the friction points in your development cycle, whether it’s a slow code review process or a testing phase that drags on forever.
- Guide Decisions: Make choices based on objective data instead of just gut feelings. This helps you prioritize work, allocate resources effectively, and make a solid case for tackling technical debt.
- Improve Predictability: Get much better at forecasting when projects will be delivered, which builds a ton of trust with stakeholders and other departments.
- Boost Team Morale: When everyone shares the same definition of success, it’s easier to celebrate wins and empower the team to see the real-world results of their hard work.
A common mistake is tracking too much and learning too little. High-performing teams don’t just measure more; they measure better, focusing on a few signals that align teams and improve delivery, not vanity metrics.
Ultimately, engineering KPIs are not about micromanaging people. They’re about understanding the health of your systems—both the technical ones and the human ones. This data-informed approach allows you to celebrate wins, tackle challenges proactively, and ensure your engineering department is a powerful engine driving the business forward.
Getting to Grips with the Foundational DORA Metrics
Before you start building a custom dashboard packed with every engineering KPI under the sun, you have to nail the fundamentals. For modern software teams, that means understanding the DORA metrics. Think of them as the battle-tested starting point—the bedrock for measuring how well you deliver software.
These aren’t just four random numbers to track. They’re a balanced set of indicators that give you a surprisingly clear picture of your entire development pipeline’s health.
The metrics came out of the work done by the DevOps Research and Assessment (DORA) team and have become an industry standard since around 2018, and for good reason. The research consistently shows a direct link between strong DORA performance and a company’s bottom line. For instance, elite-performing teams deploy code a staggering 208 times more frequently than low performers. At the same time, their Change Failure Rate stays between 0–15%, proving you can have both incredible speed and rock-solid stability.
Don’t look at these metrics in isolation. A great analogy is to think of them as the four main dials in an airplane’s cockpit. A pilot needs to watch altitude, speed, fuel, and engine status all at once to fly safely. In the same way, an engineering leader uses the DORA metrics to get a holistic view of both speed and stability.
Speed Metrics: How Fast Can You Ship Value?
Two of the four DORA metrics are all about velocity. They help you answer a simple but critical question: “How quickly can we get a new idea from a developer’s brain into the hands of our users?”
- Deployment Frequency (DF): This is just what it sounds like—how often your team successfully pushes code to production. It’s a fantastic measure of your team’s overall throughput. If your deployment frequency is high, it’s a strong sign that your release process is automated, reliable, and smooth.
- Lead Time for Changes (LT): This metric tracks the time it takes from the moment a developer commits code to the moment that same code is running successfully in production. A short lead time means your delivery pipeline is lean and efficient, without frustrating bottlenecks in code review, testing, or deployment.
Stability Metrics: How Reliable Is Your Delivery?
Speed is great, but speed without stability is just a fast way to create a mess. The other two DORA metrics are the essential counterbalance, making sure that moving quickly doesn’t mean breaking things. They answer the question: “When we do release a change, does it work? And if it doesn’t, how fast can we fix it?”
- Change Failure Rate (CFR): This is the percentage of your deployments that cause a failure in production. A “failure” could be anything that requires an emergency hotfix, a rollback, or some other immediate fix. A low CFR points to a high-quality process for reviews, testing, and deployments.
- Mean Time to Recovery (MTTR): When a failure inevitably happens, this metric clocks the average time it takes to get things back to normal. A low MTTR is the mark of a truly resilient system; it shows your team can spot, diagnose, and resolve problems in a flash.
To bring it all together, here’s a quick look at how these four metrics fit together.
DORA Metrics At A Glance
| Metric | What It Measures | Why It Matters |
|---|---|---|
| Deployment Frequency | How often you successfully release code to production. | Indicates the pace of delivery and the efficiency of your release pipeline. |
| Lead Time for Changes | The time from code commit to production deployment. | Reveals the overall speed and efficiency of your development process from start to finish. |
| Change Failure Rate | The percentage of deployments that cause a production failure. | Highlights the quality and stability of your releases, acting as a crucial check on speed. |
| Mean Time to Recovery | How long it takes to recover from a production failure. | Shows your team’s ability to respond to incidents and maintain system resilience. |
As you can see, these four key performance indicators engineering teams depend on are designed to work in harmony. If you push hard to improve Deployment Frequency but ignore the Change Failure Rate, you’re asking for trouble. For a more detailed look into this, you can learn more about what DORA metrics are and how they function.
They create a healthy tension, forcing teams to build systems that are both fast and durable—the key to delivering consistent value to your users.
Measuring Real Impact Beyond Velocity
Shipping code fast is a great start, but it’s only half the story. The real question is: did that code actually do anything for your customers or your business? Getting obsessed with pure output metrics can create a dangerous blind spot. You risk turning your engineering team into a feature factory, just churning out code without any real purpose.
It’s like running a restaurant that serves meals in record time, but nobody actually likes the food.
To avoid this trap, top-tier teams tie their work directly to user happiness and business goals. This means embracing a different set of key performance indicators—ones that measure genuine value, not just activity. It’s about making sure every line of code ships with a clear “why” behind it.
Moving From Output To Outcome
Focusing on outcomes means you’re measuring the real-world impact of your work. This is where metrics that track customer value become non-negotiable. They give you that crucial feedback loop to know if your engineering efforts are hitting the mark or just adding to the noise.
Here are three powerful KPIs that get you there:
- Time to Value (TTV): This is all about the clock. How long does it take from the moment you start working on a feature until a customer actually gets some benefit from it? A long TTV is a red flag that a feature might be too complex or its value isn’t immediately obvious to users.
- Customer Satisfaction (CSAT): Nothing beats direct feedback. Simply asking users how happy they are with a new feature gives you unfiltered insights. This qualitative data is the perfect partner to your numbers, telling you the “why” behind the what.
- Feature Adoption Rate: This KPI shows you what percentage of your active users are actually engaging with a new feature. If that number is low, it’s a clear sign that the feature might not be solving a real problem, is hard to find, or is just a pain to use.
By focusing on these outcome-driven metrics, teams stop asking “Did we ship it?” and start asking the more important question: “Did it matter?”
The Strategic Advantage of Time to Value
Engineering teams are rallying around Time to Value (TTV) for a good reason—it directly links development work to the customer experience. When TTV is high, it often points to friction like a clunky onboarding process, messy data flows, or features that just miss the mark.
For example, teams that track TTV can spot scope creep earlier and confidently cut low-impact tasks. This alone can shorten development cycles by up to 20-30% compared to teams that only chase deadlines. You can read more about engineering performance metrics at distillery.com to see how others are approaching this.
Ultimately, measuring real impact is a mindset shift. The finish line isn’t when a feature is deployed; it’s when a customer gets value from it. As you work to improve efficiency, it’s also smart to look into broader software engineering productivity metrics that can complement these value-driven KPIs. This balanced approach ensures you’re not just building fast—you’re building what counts.
Keeping Your Projects Healthy And On Budget
Great engineering isn’t just about building cool things; it’s about building them sustainably. That means keeping a close eye on the resources, timelines, and budgets that make it all possible. Shipping valuable features is always the goal, but operational excellence is what keeps the lights on. This is where financial and project management KPIs are an engineering leader’s best friend.
Think of these metrics as your project’s early warning system. They help you see around corners, spotting a potential budget overrun or schedule slip long before it becomes a five-alarm fire. By tracking the financial health of your projects, you’re not just being efficient—you’re making sure your engineering efforts can continue to deliver value long-term.
Mastering Financial And Schedule Performance
If you want to get a quick pulse on a project’s health, look no further than the Cost Performance Index (CPI) and the Schedule Performance Index (SPI). I like to think of them as the vital signs for any initiative. They give you a clear, no-nonsense number that tells you exactly how you’re tracking against the plan.
-
Cost Performance Index (CPI): This one answers a simple question: “Are we getting the value we paid for?” It’s a ratio of the work you’ve completed versus what you’ve spent. A CPI over 1.0 is great—you’re under budget. If it dips below 1.0, you’re spending more than you planned for the work done.
-
Schedule Performance Index (SPI): This metric tackles the other big question: “Are we on schedule?” It compares the work you’ve actually finished to what you planned to have finished by now. An SPI over 1.0 means you’re ahead of the game, while anything less than 1.0 means you’re falling behind.
Looking at these two numbers together gives you a remarkably clear picture. You can see if you’re on track, ahead, or if you need to step in and make some adjustments.
Balancing Resources With The Outsourcing Rate
Another important lever you can pull is your Outsourcing Rate. This is simply the percentage of your team made up of external contractors versus full-time employees. It’s a straightforward way to track your resource allocation and manage labor costs. For example, if you have 60 in-house engineers and 40 contractors, your Outsourcing Rate is 40%.
While bringing in contractors can be a great way to control expenses, it’s not a free lunch. There’s a trade-off. In fact, some data suggests that projects with outsourcing rates above 35% run a 15% higher risk of delays, often due to the extra coordination and communication required. You can find more on this at insightsoftware.com.
A project that’s on time but wildly over budget isn’t a success. Neither is one that’s under budget but months late. True project health is a delicate balance of speed, cost, and quality.
At the end of the day, keeping projects healthy is about disciplined management of time and money. While these KPIs might seem focused on constraints, they are deeply tied to your team’s output. A stable budget and a realistic timeline give your engineers the freedom to focus on what they do best: building high-quality software. To dive deeper into that side of the equation, check out our guide on how to measure code quality.
When you master these operational metrics, you’re not just managing a project—you’re building a stable foundation for real innovation.
How To Design Your Team’s KPI Dashboard
Picking out a list of metrics is the easy part. The real work begins when you try to actually implement them. Without a solid plan, even the best key performance indicators engineering teams select can end up as just another dashboard nobody looks at. Let’s walk through a practical way to choose and roll out KPIs that create a shared language for success, not just a tool for micromanagement.
The process often starts with visualizing the health of your projects at a glance, like monitoring the core constraints of budget, schedule, and resources.
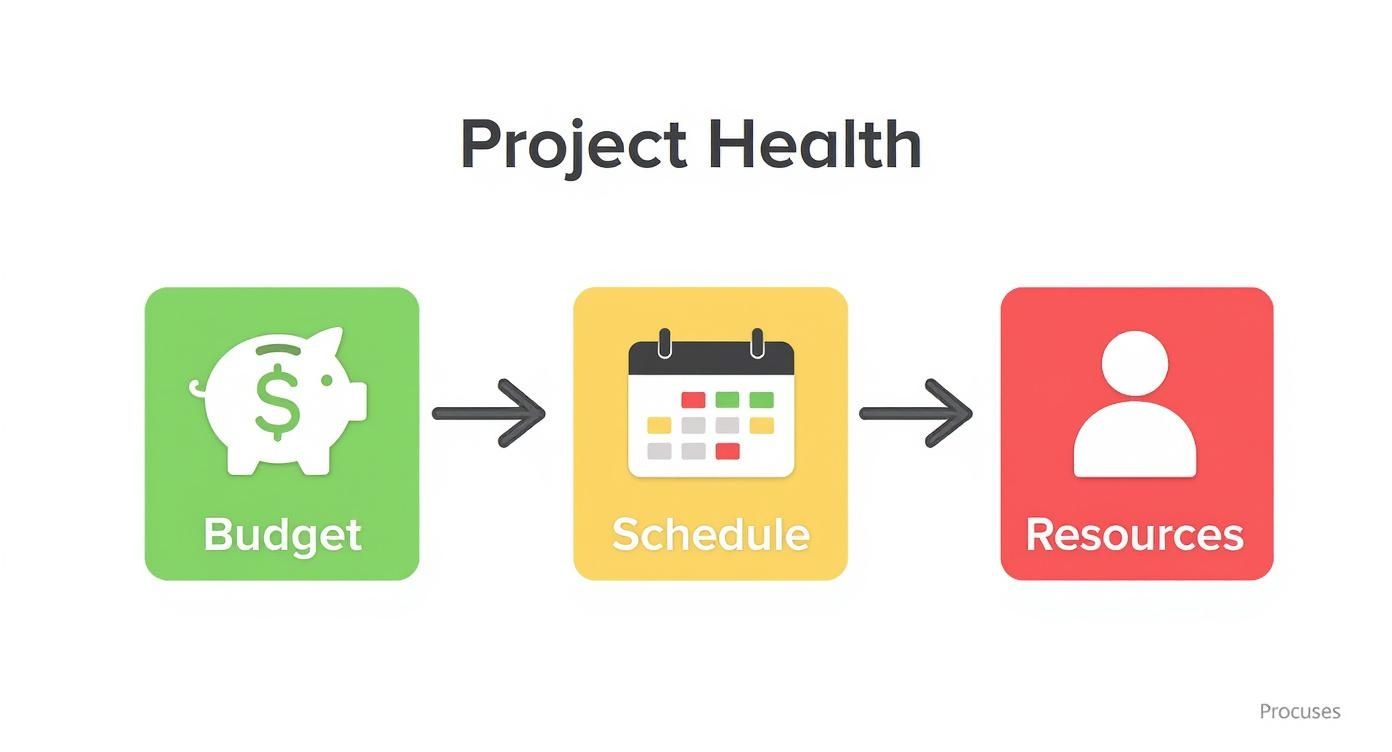
A simple red, yellow, and green system like this is powerful because it instantly communicates status, letting you know where to focus your attention without having to dig through spreadsheets.
Start With Your Goals, Not Your Data
One of the most common mistakes I see is teams looking at all the data they can track and then trying to figure out what to do with it. That’s completely backward.
Instead, start by asking: “What are our most important goals for the next quarter?” Are you trying to improve deployment stability? Crush customer-reported bugs? Ship features faster?
Once you have a crystal-clear goal, you can work backward to pick the one or two metrics that truly measure your progress. This goal-first approach guarantees every KPI has a purpose and is tied directly to an outcome that matters.
Don’t start with what’s easy to measure; start with what actually moves the needle. Your KPIs should be a spotlight guiding you toward your objective, not just a bunch of extra charts.
For instance, if your main goal is to reduce production incidents, your primary KPIs might be Change Failure Rate and Mean Time to Recovery (MTTR). Everything else is just noise.
Avoid Common KPI Implementation Traps
Even with the best intentions, it’s surprisingly easy to fall into traps that make your KPIs useless—or worse, actively harmful. Knowing what these pitfalls look like is the first step to avoiding them.
Here are a couple of the most common ones to watch out for:
- Vanity Metrics: These are the numbers that look great in a presentation but don’t mean anything for the business. Classic examples include “lines of code written” or “number of commits.” They measure activity, not impact, and can encourage all the wrong behaviors.
- Metric Fixation: This is what happens when a team gets so obsessed with improving a single number that they lose sight of the bigger picture. Imagine pushing to increase Deployment Frequency but ignoring Change Failure Rate. You might ship code faster, but you’re also shipping a lot more bugs.
Use The SMART Criteria For KPI Selection
To make sure your chosen KPIs are actually effective, run them through the SMART framework. It’s a simple but powerful checklist that helps you select metrics that are clear, actionable, and tied to your real objectives.
A truly effective KPI has to be:
- Specific: It measures one particular outcome, not a vague concept.
- Measurable: You can actually quantify and track it.
- Achievable: The team has a realistic ability to influence the number.
- Relevant: It connects directly to a team or business goal.
- Time-bound: You’re tracking it over a specific, meaningful timeframe.
This framework forces you to go from a fuzzy idea like “improve quality” to a concrete, trackable goal like “reduce customer-reported bugs by 15% this quarter.”
Every engineering team’s priorities are different, and your KPIs should reflect that. The right metrics for a team focused on rapid innovation won’t be the same as for a team responsible for mission-critical infrastructure. This table can help you map your strategic goals to the KPIs that matter most.
Choosing Your Engineering KPIs
| If Your Goal Is… | Primary KPIs to Consider | Secondary KPIs to Watch |
|---|---|---|
| Improving Stability & Reliability | Change Failure Rate and MTTR | Uptime, Error Rate, and Deployment Frequency |
| Increasing Development Velocity | Cycle Time and Deployment Frequency | Work in Progress (WIP) and Code Churn |
| Enhancing Product Quality | Customer-Reported Bug Rate | Change Failure Rate and Feature Adoption Rate |
| Boosting Team Productivity | Work in Progress (WIP) and Code Churn | Cycle Time and Developer Satisfaction (e.g., via surveys) |
Remember, this isn’t about picking metrics from a list and calling it a day. It’s about having a thoughtful conversation with your team about what success truly looks like and then finding the best way to measure that progress. The “Secondary KPIs” are crucial for providing context and ensuring you’re not accidentally causing problems elsewhere.
Common Questions About Engineering KPIs
Diving into the world of engineering KPIs often brings up more questions than answers. It’s easy to get tangled in the details, so let’s clear up some of the most common sticking points. Getting these fundamentals right is the difference between a system that helps your team thrive and one that just adds noise.
Even seasoned leaders can stumble when putting metrics into practice. The real goal here is to build a culture of improvement and transparency, not create a system that feels like Big Brother is watching.
How Many KPIs Should An Engineering Team Track?
There’s no magic number, but if I had to give a guiding principle, it would be “less is more.” Seriously. One of the most common mistakes I see is teams trying to track everything. This just creates a cluttered dashboard, dilutes focus, and leads to a classic case of analysis paralysis. No team on earth can meaningfully improve ten different things at once.
A great starting point is to pick 3-5 key indicators that are tightly coupled with your team’s most urgent goals. For instance, if your main focus right now is making deployments more stable, you might zero in on DORA’s Change Failure Rate and Mean Time to Recovery (MTTR), and maybe a quality metric like open bug count. The trick is to choose metrics that tell a clear story and point toward actionable changes.
A crowded dashboard is often a sign of an unfocused strategy. The best ones are simple, showing only the vital signs of your team’s health and its progress toward a clear, shared objective.
And remember, these aren’t set in stone. Plan to revisit your KPIs quarterly. As your team’s objectives shift, your measurements have to shift with them.
Can We Use KPIs To Measure Individual Developer Performance?
Tread very, very carefully here. In fact, I’d advise against it entirely. Using metrics like “lines of code written” or “number of commits” to gauge an individual’s performance is not only a flawed approach but a genuinely destructive one. It encourages all the wrong behaviors—like shipping bloated, unnecessary code just to hit a number—while completely ignoring what actually makes an engineer great.
Think about it. So much of engineering excellence is about collaboration, mentoring junior devs, elegant problem-solving, and the deep, focused work that precedes a single line of code. You can’t stick a number on those things. KPIs are most powerful—and safest—when applied at the team or system level. They’re meant to help you spot systemic issues and measure collective progress, not to create a developer leaderboard.
How Do We Start Implementing KPIs From Scratch?
If you’re starting with a completely blank slate, the key is to start small and build momentum. Don’t try to roll out a sophisticated, multi-tool system overnight. That’s a recipe for failure.
Here’s a simple, three-step approach:
- Define One Clear Goal: Get everyone to agree on a single, straightforward objective. Something like, “We need to get faster at fixing bugs in production.”
- Pick One or Two Metrics: Choose a metric or two that directly measures that goal. For our bug-fixing example, Mean Time to Recovery (MTTR) is a perfect fit.
- Track Manually First: Seriously, just use a spreadsheet for a few weeks. This is a low-effort way to test the waters, understand the data you’re collecting, and prove that tracking this stuff is actually valuable.
Once you start seeing the benefits and the team gets into the rhythm of looking at the data, then you can think about investing in automated tools like LinearB or Jellyfish. The most important first step is building the habit of making data-informed decisions. Make sure to involve the whole team from day one—their buy-in and insights are invaluable.
What’s The Difference Between A Metric And A KPI?
This is a classic point of confusion, but the distinction is actually pretty simple and incredibly useful.
Here’s the easiest way to think about it: all KPIs are metrics, but not all metrics are KPIs.
A metric is just a number—a quantifiable measurement of something. The number of deployments your team does per day? That’s a metric. It’s just a piece of data, sitting there.
A Key Performance Indicator (KPI), however, is a metric you’ve specifically chosen because it is critical to hitting a major strategic goal. The number of daily deployments is just data (a metric). But if your company’s big-picture goal is to out-innovate the competition, then that “Deployment Frequency” metric suddenly becomes a KPI. It’s a direct signal of your ability to deliver value to customers faster.
The “K” for Key is what really matters. It elevates a simple number into a signpost that tells you if you’re on the right track to success.
Mastering Engineering KPIs
Use this guide to shift from tracking busywork to measuring the engineering efforts that truly drive business value.
📊 Core Metrics
- Lead Time for Changes — The total time from code commit to production deployment.
- Change Failure Rate (CFR) — The percentage of deployments that cause a production failure.
- Time to Value (TTV) — The time it takes for a user to gain a real benefit from a new feature.
🕹️ My Cheatcodes
- 🌱 Start with Goals, Not Data — Define what success looks like first, then find the metric to track it.
- 🦎 Balance Speed & Stability — Pair velocity metrics (like Deployment Frequency) with quality metrics (like CFR).
- ⚡ Measure Systems, Not People — Use KPIs to diagnose process health, not to evaluate individual engineers.
✅ Before Launching Your KPIs
- 🔍 Define one clear, primary goal for the quarter.
- 📊 Get team buy-in on the "why" behind each metric.
- 🧭 Pick a balanced set of 3-5 indicators (e.g., speed, quality, impact).
- 📈 Establish a baseline by tracking metrics before making changes.
Gallery
Lemon shots



