
How to Measure Velocity in Agile Teams

To get a handle on your team’s velocity, you’re essentially looking at the average amount of work—often measured in story points—that your team completes in a single sprint. By looking back over the last few sprints, you establish a baseline that helps you predict what your team can realistically take on in the future.
It’s a straightforward concept, but incredibly powerful for forecasting.
What Velocity Really Tells Your Agile Team

Let’s get one thing straight right away: velocity isn’t a productivity score. It’s not a tool for performance reviews or a way to pit one team against another. Think of it more like a compass that points toward predictability. Its real job is to help a team figure out its sustainable pace.
Once you establish a stable velocity, you’ve got an amazing forecasting tool on your hands. It’s the metric that helps you manage stakeholder expectations by giving a data-backed answer to the classic question, “So, when will it be done?” This simple number turns release planning from a guessing game into a realistic conversation.
The True Purpose of Velocity
Think of velocity as a health check for your team’s workflow. If you see it bouncing around wildly or trending downward, that’s a sign that something is causing friction. It’s your cue to start asking some important questions:
- Are our user stories too vague or just too big?
- Is the team hitting unexpected roadblocks or waiting on other teams?
- Are we all on the same page about what “Done” actually means?
Digging into these questions helps you pinpoint what’s slowing the team down and fine-tune your sprint planning. The most common way to do this is by tracking the story points completed in each sprint. Back in 2020, industry data showed that over 70% of Agile teams relied on story points, and using them has been shown to improve project predictability by up to 40%.
Shifting from Scorekeeping to Forecasting
When you use velocity the right way, it shifts the entire team’s focus from just being busy to delivering consistent value. It’s not about tracking hours; it’s about understanding how much real, customer-facing work is getting shipped. This change is vital for building trust with stakeholders and preventing burnout.
Velocity is a measure of a team’s capacity for planning, not a measure of its productivity. Its value lies in its ability to help the team forecast, not to be used as a performance metric.
At the end of the day, velocity is just one part of a bigger picture. To get a full understanding of your team’s health and effectiveness, you need to look at it alongside other software engineering productivity metrics. The goal isn’t to constantly chase a higher number. The real win is achieving a stable, reliable velocity that helps your team confidently make—and keep—its commitments.
Setting the Stage for Accurate Measurement
Before you can even think about measuring velocity, you have to get your house in order. So many teams get excited and jump straight into tracking story points, but then they get frustrated when their numbers are all over the place and don’t mean anything. Here’s a hard truth: a reliable velocity metric comes from consistent team habits and a well-groomed backlog, not just a fancy tool.
Getting this foundation right isn’t about busywork. It’s about creating an environment where the numbers you’re tracking are actually trustworthy. If you skip this part, your forecasts will be built on sand, and you’ll just end up with missed deadlines and frustrated stakeholders. The goal isn’t to be perfectly precise on day one, but to build enough consistency that a clear signal starts to emerge from the noise.
Crafting High-Quality User Stories
It all starts with the work itself. The number one cause of a volatile velocity? Vague, oversized, or poorly defined user stories. If the team doesn’t truly understand what they’re being asked to build, any estimate they give is just a wild guess.
To fix this, every story has to be properly refined before it gets anywhere near a sprint. This means making sure each one is:
- Clear and Concise: Written from the user’s point of view, focusing on what they need and why.
- Small and Testable: Broken down into the smallest possible chunk of value that can be built and validated on its own.
- Backed by Acceptance Criteria: A simple checklist that spells out exactly what needs to be true for the story to be called “done.”
This level of clarity is crucial because it eliminates ambiguity, which is the mortal enemy of consistent estimation. Once everyone is on the same page about the scope, the team’s ability to size the work gets a whole lot better.
Mastering Relative Estimation
With well-defined stories in hand, it’s time to estimate. The trick here is to use relative estimation, not time-based guesses like hours or days. We’re humans, and we’re much better at comparing things to each other than we are at predicting the future. Sizing stories relative to one another is a more natural and sustainable way for a team to think about complexity and effort.
A fantastic technique for this is Planning Poker. It’s a simple exercise where the team uses a set of cards (usually a modified Fibonacci sequence like 1, 2, 3, 5, 8, 13) to vote on a story’s size. The magic isn’t in the number itself but in the conversation it sparks. When a developer votes an 8 and a QA engineer votes a 3, you’ve just uncovered a hidden assumption that needs to be discussed.
The point of estimation isn’t about getting the number exactly right. It’s about triggering the conversation that leads to a shared understanding of the work. Consistency in how you size things is way more important than absolute accuracy.
Establishing Your Non-Negotiables
Finally, a couple of ground rules are non-negotiable if you want your measurements to be dependable from one sprint to the next. Think of these as the guardrails that keep the team’s rhythm steady.
First, lock in a fixed sprint length. It doesn’t matter if it’s one, two, or three weeks—pick one and stick with it. If you keep changing the sprint duration, you can’t compare the output from one period to another. It’s like trying to measure speed when the finish line keeps moving.
Second, you need a crystal-clear, team-wide Definition of Done (DoD). This is your shared pact on what it means for a story to be truly finished. It should be a checklist covering everything from coding and peer reviews to testing and documentation. If a story doesn’t meet every single item on the DoD, it isn’t “done,” and its points do not count toward that sprint’s velocity. No exceptions.
With these foundational pieces in place, you’re ready to see how effective agile development sprint planning can transform these principles into a powerful, repeatable process.
Getting Down to Brass Tacks: How to Calculate Team Velocity
Alright, you’ve laid the groundwork. Now, let’s get into the actual math of measuring velocity. Don’t worry, this isn’t some complex algorithm; it’s a simple, repeatable process that gives you a powerful data point for your team.
You should expect your first few sprints to be a bit all over the place. That’s completely normal as the team finds its groove. Stick with it, and soon enough, a clear, predictable number will start to take shape. The whole point is to turn a collection of sprint results into one reliable average. This average is what you’ll use for forecasting and planning, making abstract story points feel much more concrete.
This diagram breaks down the core loop. It all comes down to a cycle of refining stories, estimating them consistently, and getting them to ‘Done.’ That’s what feeds the velocity data.
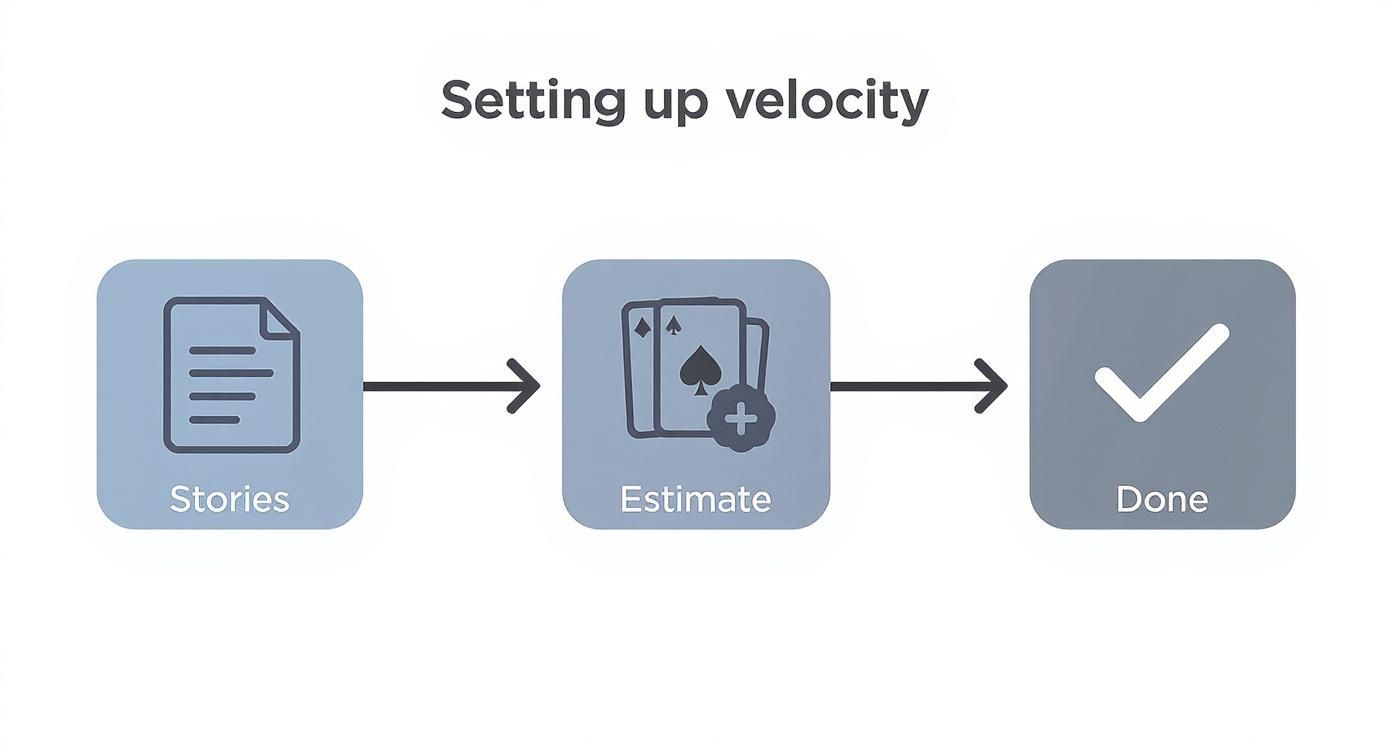
As you can see, a reliable velocity metric really hinges on a disciplined process. Only work that is 100% finished should ever count toward that final number.
Your First Velocity Calculation
The calculation itself couldn’t be simpler: add up the story points for all user stories that are 100% complete at the end of a sprint. That’s your velocity for that one sprint. Easy.
Let’s walk through a quick example. Picture a team that just wrapped up its first three two-week sprints:
- Sprint 1: The team managed to complete stories totaling 28 points.
- Sprint 2: They hit a better stride and finished 35 points.
- Sprint 3: A public holiday threw a wrench in the works, and they delivered 30 points.
With three sprints in the books, you can now find your team’s average velocity. Just add the totals together (28 + 35 + 30 = 93) and divide by the number of sprints (3).
The result is an average velocity of 31. This number becomes your baseline for planning the next sprint. It’s not a guess; it’s a real average based on what your team has proven it can do.
Here’s the golden rule: partially finished work always counts for zero points. If a story is 99% of the way there but doesn’t meet your ‘Definition of Done,’ its points do not count for that sprint’s velocity. This might feel harsh, but it’s the only way to keep the metric honest and useful.
Handling Real-World Messiness
Life happens. Sprints get interrupted. The most important thing for an accurate velocity is sticking to your guns on the ‘Definition of Done.’ The moment your team starts giving partial credit or counting points for unfinished work that just rolls over, the metric gets inflated and becomes useless for forecasting.
Here’s how to handle common situations the right way:
- Unfinished Stories: The story simply moves to the next sprint or back into the backlog. Its points are only counted in the sprint where it is finally and fully completed.
- Bouncing Numbers: Don’t stress if your first few sprints look wildly inconsistent. I’ve found it usually takes about three to five sprints for a team to settle into a rhythm and for the average to become a number you can trust.
If you’re using tools like Jira or Azure DevOps, they’ll handle the calculations for you by tracking ticket statuses. Still, understanding how it’s done manually means you’ll know exactly what the numbers represent and can spot when something is throwing them off.
At the end of the day, your velocity is a guide, not a report card. It’s there to help you plan with more confidence.
Putting Your Velocity Data to Work for Forecasting
https://www.youtube.com/embed/9pBhCBCMY98
Once your team’s velocity starts to stabilize, you’ve unlocked its real power. It stops being just a historical number and becomes a surprisingly accurate tool for looking into the future. This is where you move past simply calculating velocity and start using it to answer those big, high-stakes questions that always come from leadership.
Suddenly, you have a data-backed way to answer things like, “When will this epic be finished?” or “What can we realistically ship by the end of the quarter?” This completely changes the conversation from wishful thinking to confident, probability-based planning.
From Average Velocity to Realistic Forecasts
A single average velocity number is a decent starting point, but let’s be honest—software development is never that simple. To build a forecast that holds up under pressure, it’s much smarter to use a velocity range. This approach immediately shows everyone the natural uncertainty we all work with and manages expectations way more effectively.
Here’s a practical way to figure out your range:
- Best-Case Velocity: Find your single most productive sprint from the last five.
- Worst-Case Velocity: Now, find the least productive sprint in that same timeframe.
You’re now armed with three powerful numbers: your average, your best, and your worst. This trio lets you frame forecasts not as a single, fragile deadline but as a probable range of outcomes. It builds a ton of trust because you’re acknowledging upfront that things can, and often do, go sideways.
Answering the Big Questions with Data
Let’s walk through a real-world example. Say your team has a big epic on the horizon, and the backlog for it adds up to 200 story points. Looking at your last five sprints, your velocity has been 30, 35, 25, 32, and 28.
From that, we can pull out our key forecasting numbers:
- Average Velocity: 30 points per sprint
- Best-Case Velocity: 35 points per sprint
- Worst-Case Velocity: 25 points per sprint
With this data in hand, you can finally answer the “When will it be done?” question with real confidence:
- Most Likely Scenario: 200 points / 30 points per sprint = ~7 sprints
- Optimistic Scenario: 200 points / 35 points per sprint = ~6 sprints
- Pessimistic Scenario: 200 points / 25 points per sprint = 8 sprints
Instead of just promising a seven-sprint delivery, you can now say: “Based on our team’s actual performance, we’re projecting this epic will take between 6 and 8 sprints to complete. Our most likely target is 7 sprints.” This kind of communication is honest, transparent, and completely defensible.
This idea of using consistent data to sharpen predictions isn’t just a software thing. In geodesy, scientists use incredibly precise satellite data to track the movement of tectonic plates. By analyzing this data over long periods, they can achieve velocity uncertainties as low as 0.1 millimeters per year. It’s a great reminder that consistent measurement, no matter the field, is the key to better forecasting. You can learn more about these precise measurement techniques on agupubs.onlineli`brary.wiley.com.
A forecast is not a promise; it’s a planning guide. Presenting velocity as a range helps stakeholders understand it’s a tool for making informed decisions, not an unbreakable contract.
At the end of the day, velocity is just one piece of the puzzle. To get a truly complete picture of team health and performance, it’s a good idea to see how it fits in with other important KPIs for engineering teams. By using solid velocity data to guide your planning, you empower your team to make commitments they can actually keep.
Common Velocity Pitfalls and How to Dodge Them

Measuring velocity looks straightforward on the surface, but it’s incredibly easy to get wrong. When you use it correctly, it’s one of the best forecasting tools you have. But get it wrong, and it can become toxic, fast.
I’ve seen this happen time and again. The biggest mistakes usually aren’t about the math itself; they’re about the culture and how people interpret the numbers. Knowing what these traps look like is the first step to making sure velocity stays a tool for empowerment, not a stick to beat the team with.
Comparing Velocity Between Teams
This one is probably the most common—and most destructive—mistake I see. You look at Team A, and they’re hitting 40 points per sprint. Then you see Team B is only at 25 points. It’s tempting to draw conclusions, but it’s also completely wrong.
Story points are relative and unique to each team. Team A’s “5-point” story could be vastly different from Team B’s. Trying to compare them is like comparing apples and oranges, and it only breeds resentment and unhealthy competition. The team with the lower number either burns out trying to catch up or, more likely, just starts inflating their estimates. Suddenly, your reliable forecasting metric is useless.
The Fix: Treat each team’s velocity as its own private language. It’s for them, and them alone, to understand their own capacity. Never, ever create leaderboards or use the numbers to compare teams in performance reviews.
Using Velocity as a Performance Metric
As soon as you tie velocity to performance reviews, bonuses, or promotions, you’ve killed its value. It’s human nature. If a team is judged by a number, they will do whatever it takes to make that number go up.
This inevitably leads to some pretty bad habits:
- Story Point Inflation: Simple tasks magically become more “complex” to pump up the numbers.
- Quality Takes a Nosedive: The focus shifts from doing good work to just getting work across the “done” line. This means more bugs and more technical debt down the road.
- Innovation Grinds to a Halt: No one wants to take on a risky, innovative project that might not yield predictable story points. They’ll stick to the safe, easy wins instead.
Ignoring Important Context
Velocity isn’t a constant. It’s supposed to fluctuate. Think about it—a team’s capacity changes all the time. Real-world studies show this happens everywhere. A hydrology study on the Sacramento River, for example, took over 1,200 velocity measurements and found that flow rates changed dramatically based on environmental factors. You can learn more about the importance of context in velocity measurement on data.gov.
The same goes for your team. A sprint with a major holiday, a key developer out on vacation, or a focus on fixing gnarly tech debt is going to have a lower velocity. That’s not a sign of a problem; it’s an expected outcome.
The Fix: Always talk about velocity with context. The numbers are the “what,” but you need the “why.” Your sprint retrospective is the perfect place for this. If velocity dipped, was it because a new person was onboarding? Or because the team finally tackled that one bug that’s been plaguing everyone for months? Understanding the story behind the numbers is what makes the metric truly useful.
Answering Your Top Questions About Agile Velocity
As teams start getting the hang of tracking velocity, the same questions almost always come up. It’s totally normal. Getting straight answers to these is crucial for making the metric work for you, not against you. Let’s tackle some of the most common ones I hear.
What Should We Do If Our Velocity Is Unstable?
First off, don’t panic. An unstable velocity isn’t the real problem; it’s a symptom pointing to something deeper. If your team’s numbers are all over the map from one sprint to the next, it’s a clear sign to take a closer look at your core processes.
Usually, the culprit is one of a few things:
- Inconsistent Story Sizing: Does everyone on the team really agree on what an “8-point” story feels like compared to a “5-pointer”? If not, your estimates won’t be reliable.
- A Blurry “Definition of Done”: When the finish line is vague, it’s no wonder work doesn’t get completed consistently.
- Constant Interruptions: Unplanned work is a sprint killer. If your team is constantly being pulled in different directions, velocity will suffer.
- Team Changes: Someone new joining or a veteran leaving will naturally disrupt the team’s flow for a little while. That’s just part of the process.
Instead of chasing a specific number, focus on strengthening these fundamentals. A stable velocity will naturally follow once your process becomes more consistent.
How Do We Account for Bugs and Technical Debt?
This is a big one, and my answer is simple: treat all work equally.
That means bugs, chores, and those nagging tech debt tasks all get story points, just like brand-new features. They go into the backlog and get prioritized right alongside everything else.
When you do this, your velocity becomes an honest reflection of your team’s entire capacity. It captures all the effort—not just the shiny new stuff—that goes into keeping the product running and healthy. This gives you a much more realistic picture of what the team can actually get done.
If you only award points for features, you’re making a massive amount of work invisible. Estimating everything gives you the data to show why it’s so important to tackle that tech debt.
Can We Use Velocity as a Team Performance KPI?
Let me be blunt: absolutely not. This is the single fastest way to make velocity a useless, and even harmful, metric.
Velocity is a planning tool for the team. It is not a productivity score for management. The second you tie it to performance or start comparing Team A’s velocity to Team B’s, you create all the wrong incentives.
What happens? Teams learn to game the system. They’ll start inflating story point estimates to make their numbers go up. And just like that, the metric’s power for forecasting—its entire reason for being—is completely gone.
What Is a Good Velocity for an Agile Team?
There is no magic number. A “good” velocity for one team is meaningless to another because story points are relative.
So, what should you aim for? A velocity that is stable and predictable for your team.
That’s the real prize. A stable velocity means your team has hit a sustainable rhythm. It gives you a reliable number you can actually use to plan future work and set realistic expectations. Predictability, not a high score, is the goal.
Master Your Agile Velocity
Let’s turn velocity from a confusing, often-dreaded number into your team’s most reliable forecasting tool. When you get it right, it’s not about pressure; it’s about predictability.
What to Look for in Your Velocity Metrics
Instead of just glancing at a single number, a seasoned team looks at velocity from a few different angles to get the full picture.
-
Average Velocity: This is your bread and butter. Look at the story points your team actually completed over the last 3-5 sprints. This smooths out any single oddball sprint and gives you a much more realistic baseline.
-
Velocity Stability: How much does your velocity swing from one sprint to the next? A high variance means your planning is probably a shot in the dark. The goal is to get this number as stable as possible, which tells you your process is becoming predictable.
-
Forecast Accuracy: This is the ultimate test. How close are your sprint commitments to what you actually deliver? If you’re consistently over- or under-committing, it’s a clear sign that you need to adjust how you’re using your average velocity during planning.
A Few “Cheat Codes” I’ve Learned Along the Way
Over the years, I’ve found a few simple rules that make all the difference. Think of these as shortcuts to getting velocity right.
Consistency Over Accuracy: Stop trying to perfectly map story points to hours. It’s a trap! The real power comes from sizing work relative to other tasks. Is this a 5-point task because it’s roughly twice as complex as that 2-pointer? That’s all that matters.
Count “Done-Done” Only: This is non-negotiable. If a story isn’t 100% complete according to your team’s “Definition of Done,” it gets zero points for the sprint. It might feel harsh at first, but it eliminates wishful thinking and gives you a brutally honest (and useful) velocity number.
Measure, Don’t Weaponize: This is the golden rule. The moment you use velocity to compare developers or teams, the metric becomes useless. People will game the system, and you’ll lose all trust. Velocity is a tool for planning and forecasting—period.
Questions to Ask During Your Retro
To keep your velocity metric healthy and honest, your team should be asking some tough questions regularly.
- Are we letting partially completed work inflate our velocity?
- Is our ‘Definition of Done’ crystal clear and respected by everyone on the team?
- Are we accounting for team changes (like new hires, vacations, or departures) when we look at our velocity trends?
Your Pre-Sprint Planning Checklist
Before you hit “start sprint,” run through this quick mental checklist. It can save you a lot of headaches later.
✅ Do all stories have a point estimate? (No exceptions!)
✅ Did we review the last 3 sprints to find our stable, average velocity?
✅ Does our sprint commitment realistically align with that average?
✅ Are we communicating our forecasts as a range (e.g., “we’ll likely finish this in 4-5 sprints”) instead of a fixed, high-pressure date?
## Master Your Agile Velocity
Turn a confusing number into your team's most reliable forecasting tool.

### Velocity Metrics
1. 📊 Average Velocity — story points completed over the last 3-5 sprints
2. ⚖️ Velocity Stability — the variance in points sprint-over-sprint
3. 🎯 Forecast Accuracy — how closely sprint commitments match delivery

### Cheatcodes
🕹️ My Cheatcodes
- 🌱 Consistency Over Accuracy — focus on relative sizing, not perfect time estimates
- 🦎 Count "Done-Done" Only — partially finished work counts for zero points, no exceptions
- ⚡ Measure, Don't Weaponize — use velocity for team planning, never for performance reviews

### Reflection Points
📈 Reflection Points
- 💡 Is our Definition of Done clear and respected by everyone?
- 🧩 Are we letting partially completed work inflate our numbers?
- 📘 Do we account for context like team changes or holidays in our trends?

### Checklists
✅ Before sprint planning
- 🔍 All stories have a point estimate
- 📊 Last 3 sprints reviewed for a stable average
- 🧭 Sprint commitment aligns with that average
- 📈 Forecasts are communicated as a range, not a fixed date
Gallery
Lemon shots



