
How to measure developer productivity: A practical guide

For years, engineering leaders have been stuck on a tricky problem: how do you actually measure developer productivity in a way that helps, not hurts? The old way was to fall back on simple, visible metrics that felt tangible but ended up being misleading and, frankly, destructive.
This required a complete shift in thinking—moving away from tracking individual output and focusing instead on team outcomes and the overall health of the system. The best way I’ve found to do this is by blending quantitative data, like the metrics from the DORA framework, with qualitative insights you can only get from talking to your developers. This balance is what gives you a real, honest picture of how effective your team is without creating a culture of micromanagement and mistrust.
Moving Beyond Harmful Productivity Metrics
The traditional metrics often created more problems than they solved. Counting lines of code, for instance, just encourages developers to write bloated, inefficient code. It actually penalizes them for doing essential work like refactoring, which often reduces the number of lines but massively improves quality and maintainability.
It’s the same story with tracking commit frequency or the number of pull requests. These numbers tell you nothing about the complexity, quality, or impact of the work being done.
“A focus on individual activity metrics like commits or story points creates a low-trust environment. It encourages developers to optimize for the metric, not for the outcome, which is the opposite of what you want.”
This outdated approach completely misses what software development is all about: a creative process that involves problem-solving, collaboration, and careful design. When you reduce productivity to a simple number, you demotivate your best people and destroy the psychological safety a team needs to innovate and take smart risks.
Why Old Metrics Fail Modern Teams
At its core, the problem with these vanity metrics is their laser focus on what one person is doing, not what the team is achieving together. They completely ignore the fact that modern software engineering is a team sport.
A developer’s real value isn’t just in the code they ship. It’s also in the “invisible” work that makes a team great:
- Mentoring junior engineers: Taking the time to share knowledge and help others grow is a huge force multiplier.
- Improving system health: Proactively tackling technical debt or improving documentation saves everyone headaches down the line.
- Collaborating on complex designs: Those thoughtful debates and whiteboard sessions are what lead to a solid architecture, but they don’t show up in a activity tracker.
A measurement framework that actually works has to look beyond individual activity. It needs to give you a clear view of the entire development lifecycle, from the first idea to the value it delivers to a customer. That means focusing on team-level outcomes, system stability, and the overall developer experience.
Using a Framework That Actually Works

There’s no need to reinvent the wheel when it comes to measuring productivity. The smartest move is to lean on a framework that’s already been tested and proven in the real world. For engineering teams, that framework is DORA.
The DORA (DevOps Research and Assessment) metrics are the gold standard for a reason. They get you to stop focusing on vanity metrics like lines of code and start looking at what really matters: the health and effectiveness of your entire software delivery process.
What makes DORA so powerful is its built-in balance. It gives you two metrics for speed and two for stability. This is absolutely critical because it stops you from chasing speed at the expense of quality. You get a holistic view of performance, ensuring you’re not just shipping faster but also building a reliable, high-quality product.
Ultimately, these metrics track the entire journey of an idea, from a developer’s first keystroke all the way to it landing in the hands of your customers.
The Four DORA Metrics Explained
At its core, the DORA framework is a set of four interconnected metrics that provide a comprehensive look at your team’s performance. When you understand how they work together, you unlock a much clearer picture of what’s happening in your development lifecycle.
Here’s a quick breakdown of what each metric tracks and why it’s so important for understanding your team’s real-world impact.
| Metric | What It Measures | Why It Matters |
|---|---|---|
| Deployment Frequency | How often you successfully deploy code to production. | A high frequency is a sign of a healthy, automated pipeline and an agile team. |
| Lead Time for Changes | The time it takes from a code commit to deployment. | Shorter lead times mean you can deliver value and fix issues for customers faster. |
| Change Failure Rate | The percentage of deployments that result in a production failure. | A low rate points to strong testing, quality code, and a reliable delivery process. |
| Mean Time to Recovery | How long it takes to restore service after a production failure. | A low MTTR shows your team can quickly diagnose and resolve problems, minimizing user impact. |
By tracking these four metrics, you move beyond guesswork. You’re no longer just measuring activity; you’re measuring outcomes that directly influence the business and your customers.
What Elite Performance Looks Like
The DORA metrics aren’t just theoretical; they come with years of research and data from thousands of teams worldwide. This gives us clear benchmarks for what “good” and “elite” performance actually look like.
Industry studies show that elite-performing teams deploy code on-demand, multiple times a day. Their lead times are often less than a single day, and they maintain a change failure rate below 15%. When something does go wrong, they can recover from an incident in under an hour.
These aren’t just numbers to chase; they represent a state of high efficiency and resilience. By tracking these key performance indicators, you can pinpoint the real bottlenecks in your process. Is it a sluggish code review cycle? An unreliable deployment script? The data will tell you.
From there, you can work with your team to make targeted improvements. To go even deeper, check out our complete guide on KPIs for engineering teams.
The Missing Piece: Understanding the Developer Experience
Dashboards loaded with DORA metrics are great for telling you what is happening. They can show you a sudden spike in lead time or a troubling dip in deployment frequency. But they can’t tell you why.
The numbers alone don’t reveal the story behind the data. Is the team getting bogged down by technical debt? Is the local development environment a complete nightmare? Are code reviews turning into a black hole where pull requests go to die?
This is where the developer experience (DevEx) comes in. If you truly want to understand productivity, you have to look beyond system-level data and get into the human side of building software. It’s all about uncovering the friction, the frustrations, and the flow-killers your team wrestles with every single day.
I’ve found that the most effective organizations don’t just rely on quantitative data; they pair it with structured, qualitative feedback. This simple shift turns measurement from a top-down mandate into a collaborative mission to find and fix roadblocks, making work better for everyone involved.
This process creates a continuous feedback loop that drives real improvement.
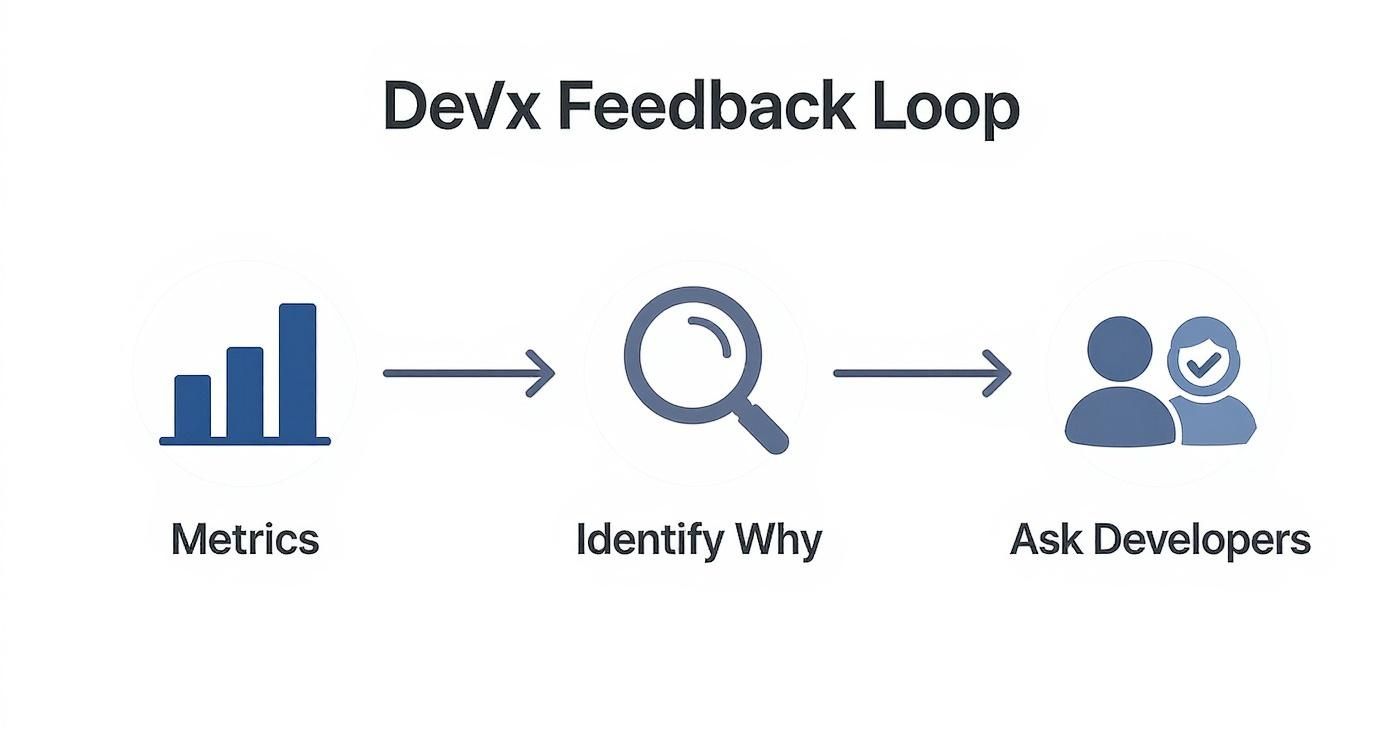
The real takeaway here is to let your dashboard data spark curiosity, not jump to conclusions. Use the numbers to figure out what to ask your developers, so you can learn the context behind the trends.
Asking the Right Questions
Getting this kind of feedback doesn’t have to be a huge, complicated effort. In fact, simple, regular surveys are an incredibly powerful way to start. The idea isn’t to run a massive annual poll, but to open a light-touch, consistent channel for communication.
You need to focus your questions on the real, day-to-day friction points. Ditch vague questions like “Are you happy?” and get specific about the workflow.
Here are a few practical examples that have worked well for me:
- “On a scale of 1-5, how easy was it to get your work done this week?”
- “What was the single most frustrating part of the development process in the last sprint?”
- “If you could wave a magic wand and fix one thing in our tooling or codebase, what would it be?”
- “How satisfied are you with the quality of our documentation?”
This mixed-methods approach is a cornerstone of how the best in the business operate. By combining quantitative data with qualitative insights, you create a holistic picture of team health and productivity.
Take Google’s Engineer Productivity Research team, for example. Since 2018, they’ve used a model that measures productivity across three key dimensions: speed, ease, and quality. They combine system logs with regular surveys that capture subjective developer experiences, like frustration with specific tools. By surveying one-third of their engineers every quarter, Google gets a continuous stream of feedback on issues that would never show up on a dashboard. You can read more about how Google measures productivity.
Turning Feedback into Action
Of course, collecting feedback is just the start. The real magic happens when you connect these human insights back to your system-level data.
Let’s walk through a real-world scenario. Your DORA metrics show that Lead Time for Changes has shot up by 20% over the last month. At the same time, your developer surveys are filled with comments about a slow and flaky build process.
Boom. You now have a clear hypothesis: fixing the build pipeline will directly improve a key DORA metric.
This connection is what makes this approach so powerful. It allows you to prioritize engineering work that not only makes life better for your developers but also delivers a measurable impact on team performance. You’re no longer guessing what to fix—your team is telling you exactly where the biggest bottlenecks are.
Practical Tools and Implementation Guides
Understanding the theory behind developer productivity is one thing, but putting it into practice is where real change happens. Luckily, you don’t have to build a complex measurement system from the ground up. There are some excellent tools out there that can automate data collection and give you immediate visibility into your engineering workflows.
Platforms like Jellyfish, LinearB, and Pluralsight Flow are built for this. They plug directly into your Git repositories, project management boards, and CI/CD pipelines to automatically calculate DORA metrics and other key indicators. This saves you from the headache of manual spreadsheet work and gives you a clear, objective baseline for how your system is performing right now.
Start Small with Data and Feedback
My biggest piece of advice here is to avoid boiling the ocean. Don’t try to track every metric under the sun from day one—that’s a recipe for overwhelming your team and getting nowhere.
Instead, start small. Pick just one or two DORA metrics that speak to your team’s most pressing challenges.
- If everyone feels like shipping new features is a grind, start by tracking Lead Time for Changes.
- If deployments feel risky and often lead to rollbacks, focus on Change Failure Rate.
Establishing this initial baseline is your first, most important step.
At the same time, you can start gathering qualitative feedback with tools you probably already use. Simple, anonymous surveys built with Google Forms or Typeform are perfect for this. They let you ask targeted questions about developer friction without any complicated setup. This two-pronged approach—a single DORA metric plus a simple survey—gives you a powerful combination of hard data and human experience right from the start.
Create Actionable Checklists
One of the most practical ways to weave measurement into your daily workflow is by simply clarifying what “done” means for common tasks. Ambiguity is the enemy of productivity. When developers have a clear, shared definition of what success looks like, measurement becomes a natural byproduct of their process, not a chore.
A great way to do this is by creating reusable checklists for recurring engineering work, like deploying a new feature or setting up a new service. This defines your quality and performance standards upfront, making it much easier to see if tasks are completed correctly and efficiently.
For example, here’s a prompt and checklist you could use to confirm a modern web deployment is done right.
✅ Prompt
“Checklist: confirm my Astro site is deployed on Cloudflare Workers with best-in-class performance, SEO, and DX. Verify adapter, asset storage, caching, hydration, and SSR/SSG choices. Give me a clear yes/no on each item and point out fixes if something’s missing.”
📝 Example Response
Astro on Cloudflare Workers — Deployment Checklist
- Adapter → Using
@astrojs/cloudflareor@astrojs/cloudflare/worker? → ✅ Yes - Static vs SSR → Static pages prebuilt + only SSR where required (API, auth, etc.) → ✅ Yes
- Cold start avoidance → Worker bundle < 1MB, no heavy deps → ✅ Yes
- Assets → Offloaded to R2 / Cloudflare Images, not bundled in Worker → ❌ No → Fix: move images to R2 and rewrite URLs
- Caching → Edge cache headers set (
Cache-Control,stale-while-revalidate) → ✅ Yes - SEO → Title/meta tags verified, hreflang (if multilingual), robots.txt and sitemap.xml generated → ✅ Yes
- Core Web Vitals → Partial hydration configured, Lighthouse score >90 → ✅ Yes
- Global Edge → Tested from multiple PoPs (US/EU/Asia) for <100ms TTFB → ✅ Yes
- Limits → Worker within 30ms CPU budget, script <10MB → ✅ Yes
- Monitoring → Wrangler tail + Analytics enabled → ✅ Yes
Result: 9/10 checks passed. Only asset storage needs fixing.
With a checklist like this, the team knows exactly what’s expected, and it becomes easy to spot where things went wrong (like the asset storage issue) and fix them for next time.
By implementing simple tools and clear checklists, you transform measurement from an intrusive mandate into a supportive part of the engineering culture. This clarity helps streamline workflows and provides a solid foundation for any productivity initiative.
Of course, tracking metrics is only one part of the puzzle. To really understand the full picture, you also need to see how developers are spending their time. To learn more about this crucial aspect, explore our guide on effective developer time tracking software.
Measuring Productivity in the Age of AI

AI code assistants have completely changed the game for developers. It’s tempting to think that just by adding these tools to the stack, productivity will shoot through the roof. But the truth is a lot more complicated than that. To really understand the impact, we have to look past simple speed metrics and see how AI changes the entire way we work.
The common assumption is that AI just makes developers faster. What this misses is all the “invisible” work that comes with using these tools. Developers don’t just copy and paste what an AI spits out. They have to carefully review it, debug it, and often refactor the code to make sure it actually fits into the existing codebase and follows team standards.
This whole validation process adds a new kind of mental overhead that our old productivity metrics just weren’t designed to see. It doesn’t mean AI isn’t helping—it just means we need a much smarter way to measure its real value.
Rethinking What “Speed” Really Means
A recent randomized controlled trial involving experienced open-source developers turned up something pretty surprising. The study found that developers using early-2025 AI coding assistants actually took, on average, 19% longer to finish their tasks than a control group working without AI.
Why? It seems that extra time was spent carefully reviewing and integrating the AI’s suggestions, which is a vital step for maintaining high code quality. This is a huge sign that looking at raw completion time is a deeply flawed way to measure performance in AI-assisted workflows.
Think about it: a developer might take a little longer on a task but end up with a more robust, thoroughly tested solution. That’s because the AI handled all the tedious boilerplate, freeing them up to focus their brainpower on the tricky stuff, like architecture and edge cases.
Measuring productivity in the AI era isn’t about “how fast did you type?” anymore. It’s about “how effectively did you use the tool to solve the problem?” We have to shift our focus from the speed of the output to the quality of the outcome.
How to Adapt Your Measurement Framework
To get a clear picture of what’s happening, your measurement framework needs an upgrade. It’s no longer enough to just track lead time or deployment frequency. You need to understand the push-and-pull between the developer and their AI assistant.
Try adding some new signals to your analysis, blending both the quantitative and the qualitative:
- AI-Generated Code Churn: How much of the code suggested by the AI is actually kept? If you see a high percentage being immediately deleted or refactored, it could point to weak prompts or a tool that isn’t quite right for your team’s needs.
- Time-to-Quality: Instead of just measuring how long it takes to complete a task, track the time it takes for a piece of code to go from initial generation to being fully reviewed, tested, and merged. This gives you a much better sense of real-world velocity.
- Direct Developer Feedback: Just ask your team. Simple surveys with questions like, “Roughly how much time did you spend validating AI suggestions this week?” or “What kinds of tasks are AI assistants helping you with most?” can give you invaluable insights.
By evolving your approach, you can get past the simple “faster is better” myth. You’ll gain a genuine understanding of how your team is using these powerful new tools, which is the first step toward coaching them on best practices. For more on this, check out our insights on the best AI for writing code.
Common Questions About Measuring Productivity
Even with the best intentions, rolling out a new way to measure productivity can stir up some valid questions and concerns. It’s totally normal. Tackling these issues head-on is the best way to build trust and get everyone comfortable with a healthier, more transparent approach.
What Are the Worst Metrics to Use?
Let’s start with what not to do. The most destructive metrics are the ones that focus purely on individual output and ignore all context. These are the classic vanity metrics that breed a culture of fear and actively punish good engineering habits.
We’re talking about things like:
- Lines of Code (LOC): This is probably the most notorious bad metric out there. It actually encourages developers to write bloated, inefficient code and penalizes smart refactoring that improves quality by reducing code.
- Commit Frequency: Sure, frequent, small commits can be a sign of a great workflow. But tracking the raw number tells you absolutely nothing about the substance or impact of that work.
- Number of Pull Requests: Just like commits, this measures activity, not value. Chasing a PR target can lead developers to slice up their work in unnatural ways just to hit a quota.
These metrics fall flat because they’re easily gamed and completely miss the point of what software development is all about: collaborative problem-solving.
How to Introduce Metrics Without Being a Micromanager
This is a big one, and the key is transparency. The second your team thinks you’re using data as a surveillance tool, you’ve lost the plot.
Frame metrics like DORA as tools for the entire team to spot and solve system-level problems—not as a scorecard for individual performance reviews. Kick things off by asking your team what’s slowing them down. Then, you can introduce the metrics as a way to put a spotlight on those shared frustrations and tackle them together.
The goal is to improve the system, not to judge the individual. When you make it clear that the data is there to help make everyone’s work life better, it shifts the dynamic from oversight to shared ownership.
Even better, get your team involved in setting the initial benchmarks and goals. When they have a say in the process from the beginning, their buy-in is practically guaranteed.
How Often Should We Review Our Metrics?
There isn’t a single answer here; different data requires a different rhythm. For the automated stuff you can pull from your CI/CD pipeline, like deployment frequency or lead time, a live dashboard works great for at-a-glance monitoring.
But the real magic happens when you talk about the trends. These team discussions should happen at a regular, thoughtful pace—maybe during your bi-weekly or monthly retrospectives. This gives everyone a chance to connect the numbers on the screen to what they actually experienced on recent projects.
For more qualitative feedback, like developer experience surveys, a quarterly cadence usually hits the sweet spot. It’s often enough to capture relevant insights without causing survey fatigue. This mix gives you a steady stream of both hard data and human feedback to guide your improvements.
Zest is an AI coding workflow manager that gives you the visibility you need to measure and improve your team’s AI-assisted development. It turns daily activity into automatic summaries and consolidates every task and tool into one feed, making it easy to spot bottlenecks and scale what works. See how your team is really using AI and learn more about Zest.
Gallery
Lemon shots



