
How to Measure Code Quality That Actually Matters

If you want to get serious about measuring code quality, you need a strategy that looks at the code’s entire journey. This means going far beyond basic linting and test coverage. It’s about blending the hard quantitative data with qualitative human insights to make sure your code is not just working, but actually built to last.
Moving Beyond Simple Linting and Test Scores
For years, engineering teams have been chasing simplistic metrics. Think 100% test coverage or zero linter warnings. While these are a decent starting point, they can create a dangerous false sense of security.
Let’s be honest, we’ve all seen that one codebase. It has perfect test coverage, but it’s an absolute nightmare for a new developer to understand. We’ve also seen projects that pass every static analysis check with flying colors, only to crumble under a real-world production load. This happens because context is everything. A high complexity score might be perfectly fine for a critical, highly-optimized algorithm, but it’s a huge red flag in a simple API endpoint.
A More Holistic Approach
The real challenge—and where the magic happens—is building a measurement framework that reflects what quality actually means to your team and your product. It’s about seeing the complete picture.
Relying solely on automated checks is like judging a chef’s skill by only checking if the oven is on. It tells you something is happening, but it doesn’t tell you if the food is any good. A holistic view combines automated analysis with the invaluable insights from your team.
This balanced approach usually breaks down into a three-stage process, flowing naturally from automated analysis, to human review, and finally to monitoring in production.
This infographic lays out a modern workflow for measuring code quality, combining static analysis, human review, and production data into a continuous loop.

The key takeaway here is that assessing quality isn’t a one-and-done event. It’s a continuous feedback loop that should inform every single stage of development.
To truly understand code quality, we need to think beyond simple pass/fail checks and look at the underlying pillars that support a healthy codebase. These pillars give us a more nuanced and realistic view of our software’s health.
The Four Pillars of Modern Code Quality
| Quality Pillar | What It Measures | Why It’s Critical |
|---|---|---|
| Maintainability | The ease with which code can be understood, modified, and extended. This includes metrics like Cyclomatic Complexity and Code Churn. | High maintainability means developers can ship features and fix bugs faster, reducing the long-term cost of ownership. |
| Reliability | How well the software performs its required functions under stated conditions for a specified period. This is about bugs, errors, and uptime. | Unreliable code directly impacts user trust and business outcomes. It’s the foundation of a good user experience. |
| Security | The code’s resilience to vulnerabilities and threats. This involves tracking things like vulnerability scan results and dependency age. | A single security flaw can lead to catastrophic data breaches, reputational damage, and financial loss. |
| Developer Experience | How effectively and enjoyably developers can work with the codebase. This is often measured qualitatively through surveys and code review feedback. | A poor developer experience leads to burnout, low productivity, and high turnover. A great one fosters innovation and team morale. |
By focusing on these four pillars, you start to answer the questions that genuinely matter for the long-term health of your project and your team.
What Really Matters
Instead of getting hung up on a single number, it’s far more effective to focus on a balanced scorecard of metrics that answer the big questions:
- Can we change it safely? This is where maintainability metrics like Cyclomatic Complexity really shine. They help you spot code that’s slowly turning into a maintenance nightmare before it’s too late.
- Does it work for our users? Reliability metrics, such as Defect Density and uptime, give you a crystal-clear view of how your code is actually behaving out in the wild.
- Can our team work with it efficiently? This is where you need to listen. Qualitative feedback from code reviews and developer surveys offers crucial, and often overlooked, insights into the real-world developer experience.
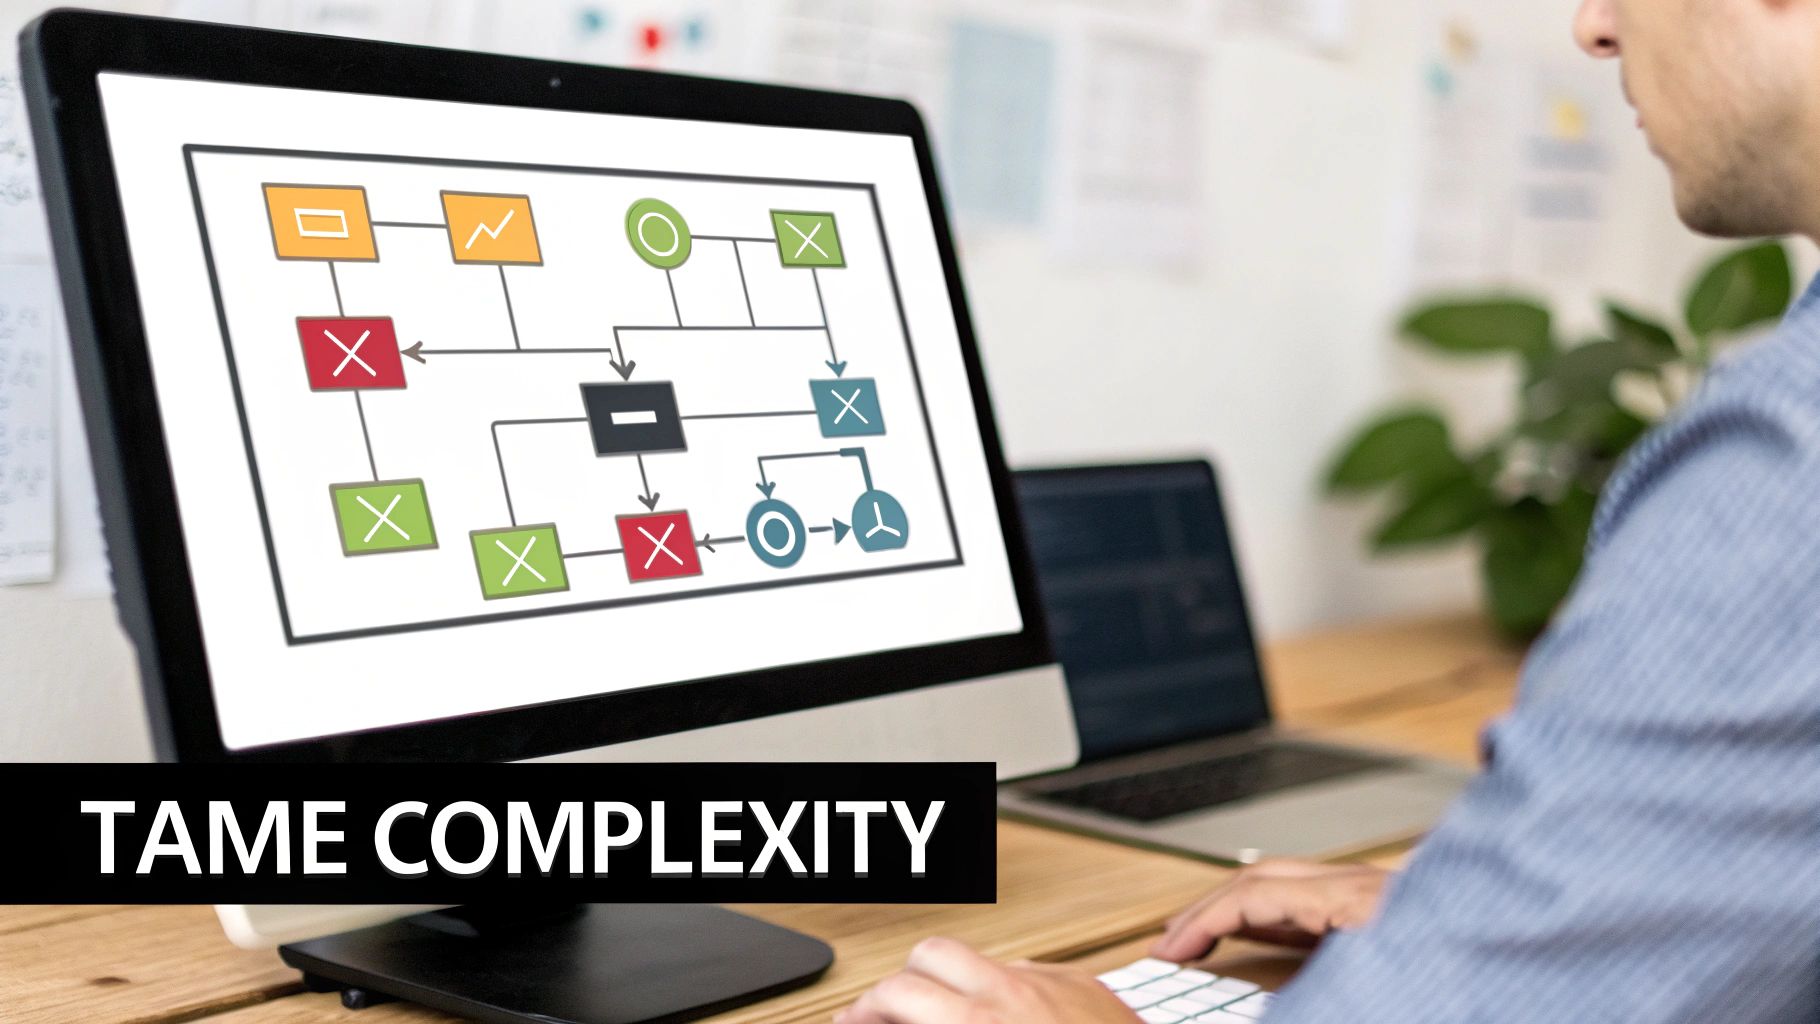
Using Maintainability Metrics to Tame Complexity

We’ve all been there: staring at a function so convoluted it feels like you need a map and a compass just to navigate it. This is where maintainability comes in. It’s the unsung hero of a productive engineering team.
When your code is straightforward and easy to change, developers can add features or fix bugs with confidence. It’s the difference between a project that can grow and adapt, and one that slowly grinds to a halt under the weight of its own complexity. But “feeling” like code is maintainable isn’t enough; we need to measure it.
This is where a metric like Cyclomatic Complexity is so valuable. It gives us a hard number to quantify just how tangled a piece of code really is.
What Is Cyclomatic Complexity?
At its heart, Cyclomatic Complexity is a classic software metric that counts the number of distinct paths through your code. Think of it as a tally of every if, for, while, and case statement—basically, any fork in the logical road.
A function with a low score, say between 1 and 5, is nice and linear. It’s easy to read, test, and debug. But as that number climbs, so does the mental gymnastics required to understand all the possible outcomes.
As a rule of thumb, it’s best to keep the Cyclomatic Complexity for any single function below 10. Anything higher is a red flag that it’s probably doing too much and is a prime candidate for bugs.
A Real-World Refactoring Example
Let’s picture an e-commerce checkout function. A new developer on your team needs to add a new payment option. They open up the processPayment function and find a labyrinth of nested if-else blocks:
if (user.isLoggedIn)if (cart.hasPhysicalItems)if (paymentMethod === 'credit_card')if (user.address.isVerified)
The function has a Cyclomatic Complexity of 15. The new developer burns half a day just trying to figure out where to slot in their new code without breaking everything. It’s a classic productivity killer.
So, the team decides to refactor. They break that single monster function into smaller, more focused helpers like validateUser, calculateShipping, and handleCreditCardPayment.
Now, the main processPayment function is just a clean, readable sequence of calls to these smaller functions. Each of the new functions has a tiny Cyclomatic Complexity score of 2 or 3. The total complexity might be similar, but the cognitive load is drastically lower because the code is practically self-documenting.
The next time someone needs to make a change, they’ll know exactly which small function to edit. This simple act saves hours of developer time and, more importantly, prevents a whole class of new bugs from ever being introduced. Tracking these kinds of engineering KPIs is how you build a high-performing team and get ahead of technical debt before it snowballs.
Gauging Reliability with Production Data
Clean-looking code in a repository is great, but code that performs flawlessly for actual users is what really counts. This is where we pivot from analyzing code before it ships to measuring how it behaves in the wild. If you’re not monitoring your application’s performance after deployment, you’re missing half the story of its quality.
Static analysis tools are fantastic for catching potential issues early, but they simply can’t predict every quirky, real-world scenario. Production data tells you what your users are actually experiencing—the good, the bad, and the buggy.
Introducing Defect Density
To get a real handle on post-deployment quality, you need a solid metric. One of the most tried-and-true measures here is defect density, which is just the number of confirmed bugs per thousand lines of code (KLOC). Think of it as a direct signal of software reliability. A low number suggests stability, while a high number points to fragile, error-prone code that will inevitably drive up your maintenance costs. You can explore more about measuring code quality at qodo.ai.
It’s essentially a health score for your codebase in its natural habitat. It answers one simple but critical question: How often is our code actually failing our users?
Tracking production metrics like defect density is how you find the “unknown unknowns.” These are the subtle, systemic issues that static analysis often misses entirely, closing the feedback loop between development and real-world impact.
By consistently measuring this, you can start to see trends, pinpoint problematic areas of your application, and make informed decisions about where to focus your refactoring efforts. It turns guesswork into a data-driven strategy.
How Production Data Uncovers Hidden Flaws
I once worked on a fintech application where our static analysis tools gave the payment module a perfect score. The code was well-structured, complexity was low, and our test coverage was excellent. Despite all that, our customer support team was constantly swamped with tickets about a specific type of failed transaction.
The problem was a ghost. The errors weren’t crashing the system, so they never triggered our basic uptime alerts. It wasn’t until we started systematically tracking defect density that we noticed a massive spike, completely isolated to that one module.
That forced us to dig in. We eventually discovered a subtle race condition tied to a third-party API’s latency. It only happened under very specific high-load conditions—something our pre-production tests had never managed to simulate.
The fix itself was small, but the impact was huge. Tracking that one production metric helped us find a systemic issue that was costing the business real money and chipping away at user trust. It was a powerful lesson in why you must measure quality with data that reflects reality, not just theory.
Static vs Dynamic Code Quality Metrics
To put it all together, it helps to see how these pre-deployment and post-deployment metrics complement each other. One looks at the code’s blueprint, the other at how the building holds up in a storm.
| Metric Type | Examples | Focus Area | Best For |
|---|---|---|---|
| Static Metrics | Cyclomatic Complexity, Code Duplication, Linter Warnings | Pre-deployment analysis of code structure and maintainability. | Catching complexity and style issues before they are merged. |
| Dynamic Metrics | Defect Density, Error Rate, Mean Time To Recovery (MTTR) | Post-deployment analysis of application behavior and stability. | Understanding real-world user impact and system reliability. |
By combining both static and dynamic metrics, you get a complete, 360-degree view of your code’s health—from the developer’s keyboard all the way to the user’s screen.
A Practical Code Review Checklist for Your Team
High-level metrics like Cyclomatic Complexity and Defect Density are great for a bird’s-eye view, but real quality happens down in the trenches—one pull request at a time. During a busy sprint, it’s tough to act on abstract goals. To actually make quality a daily habit, your team needs a concrete, repeatable process for code reviews.
We’ve all seen vague feedback like “this is too complex” or “needs more tests.” It often creates confusion, leads to inconsistent standards, and can even cause friction between teammates. The solution is to turn those big quality principles into a simple, objective checklist. This standardizes reviews, makes feedback crystal clear, and helps everyone get on the same page about what “good code” actually looks like in your project.
Building Your Pull Request Checklist
The idea is to shift from subjective opinions to objective questions. A straightforward yes/no format cuts through the ambiguity, making the review process both faster and more effective. Instead of a long, drawn-out discussion, a reviewer can quickly run through the most critical quality checks.
Here’s a practical template, inspired by real-world prompts, that you can adapt for your team’s pull requests. It’s designed to cover the core pillars—maintainability, reliability, and security—in a way that’s dead simple to follow.
A great checklist doesn’t just catch errors; it teaches and reinforces best practices with every single review. It transforms the PR process from a gatekeeping exercise into a powerful tool for mentorship and collective code ownership.
Think of this as your foundation. You should absolutely customize it to fit your team’s specific needs, your technology stack, and whatever quality issues you’re currently trying to solve.
The Ready-to-Use Code Review Template
Here is a checklist you can drop into your pull request templates today. The yes/no format is key—it drives objective assessments and keeps everyone aligned.
Code Review Checklist — Is This PR Ready to Merge?
- Readability & Maintainability → Is all new logic clear and easy to understand without needing a deep dive? → Yes/No
- Complexity → Are all new functions below the team’s Cyclomatic Complexity threshold (e.g., <10)? → Yes/No
- Testing → Does this change include meaningful unit or integration tests for its core logic? → Yes/No
- Security → Have potential vulnerabilities (e.g., SQL injection, XSS) been considered and mitigated? → Yes/No
- Documentation → Are complex sections or public APIs clearly commented or documented? → Yes/No
- Performance → Does this change avoid obvious performance bottlenecks (e.g., N+1 queries, inefficient loops)? → Yes/No
- Naming Conventions → Do all new variables, functions, and classes follow the project’s established naming standards? → Yes/No
- Error Handling → Does the code gracefully handle potential errors, edge cases, and invalid inputs? → Yes/No
By building a checklist like this directly into your workflow, you’re making quality a non-negotiable part of your daily process. It guarantees that every single change is held to the same high standard, turning abstract ideas into something you can actually measure and repeat.
If you’re looking to take this a step further, there are some great automated code review tools that can enforce many of these checks for you, freeing up your team to focus on the more nuanced parts of the code.
Making Quality a Non-Negotiable Part of Your Workflow
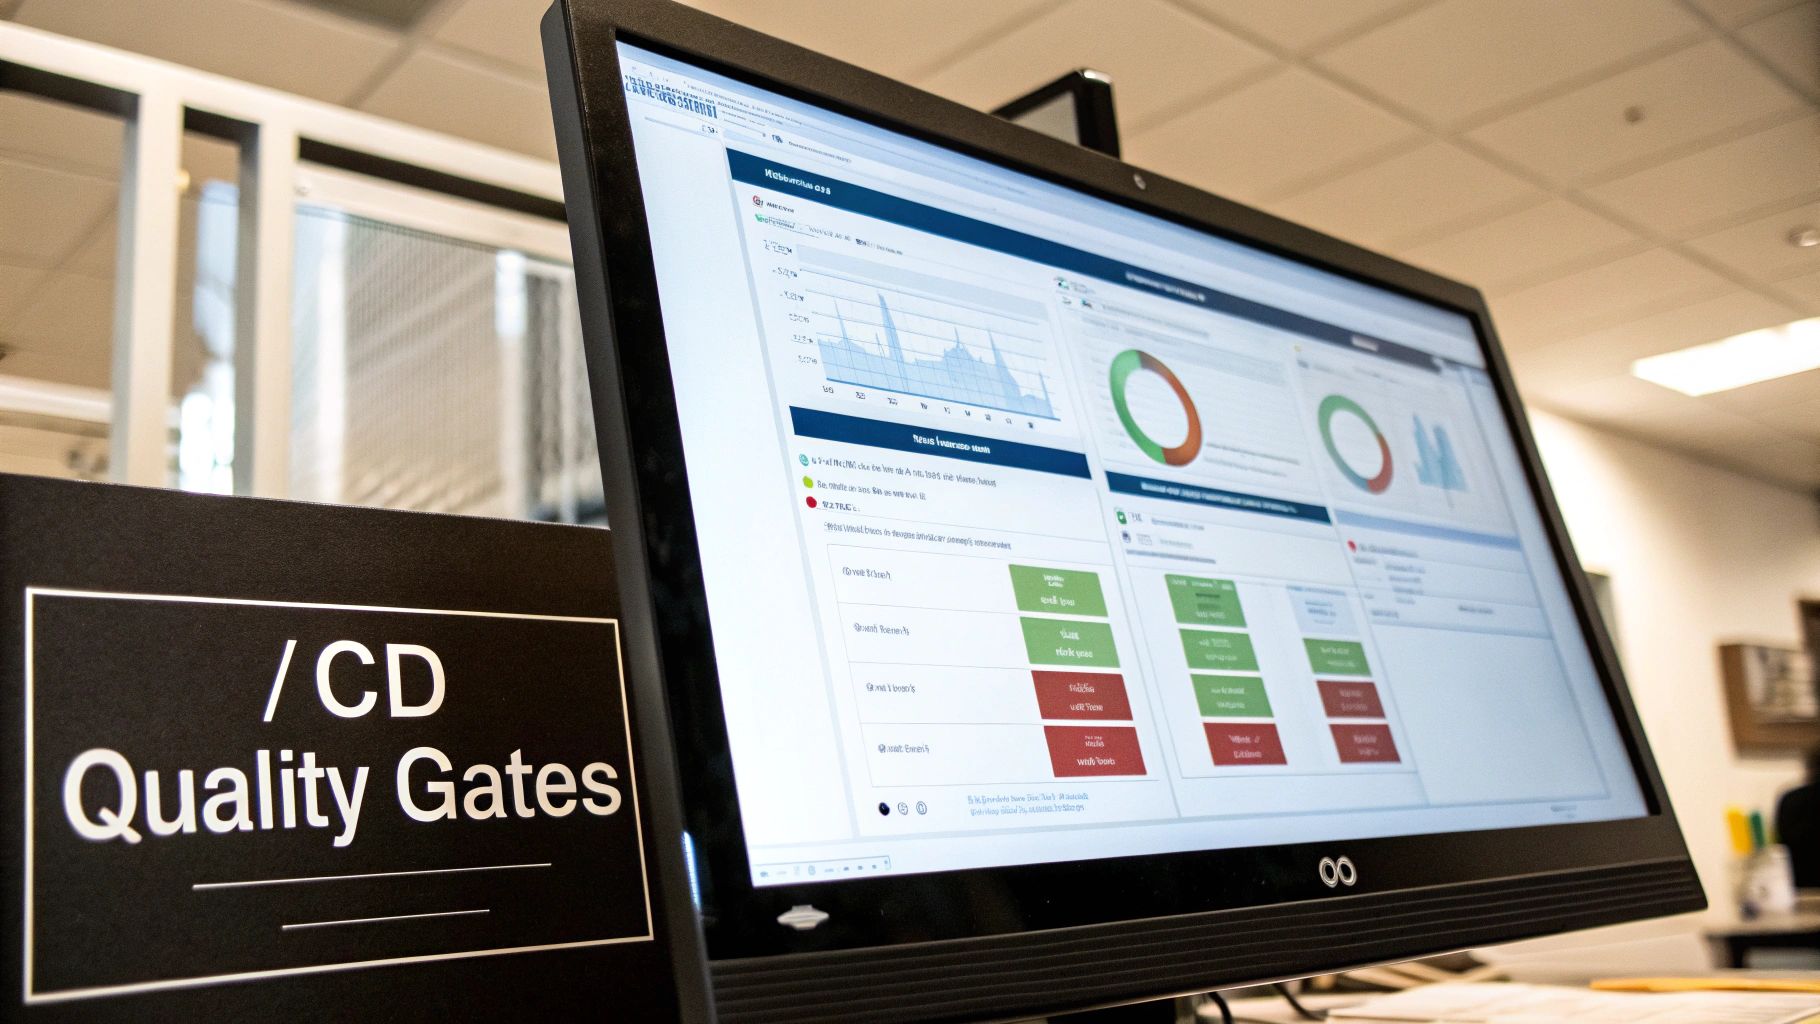
Checking code quality metrics manually is a decent starting point, but let’s be honest—it just doesn’t scale. If you want to build a culture of quality, you have to weave it directly into your development process. That’s where your CI/CD pipeline becomes your most powerful ally.
By setting up automated quality gates, you stop treating quality like an afterthought or a quarterly audit. Instead, it becomes a constant, real-time feedback loop. This simple shift prevents bad code from ever hitting your main branch and makes quality a proactive, shared responsibility for the entire team.
Setting Up Your Automated Quality Gates
The idea here is to configure your pipeline to automatically fail a build if the code doesn’t meet the standards you’ve all agreed on. This isn’t about punishing anyone; it’s about creating an automated safety net that catches problems before they become bigger headaches.
You can get this done with a bunch of great tools that plug right into systems like GitHub, GitLab, or Bitbucket.
- SonarQube: This is pretty much the industry standard for a reason. It goes deep, analyzing everything from complexity and security holes to code smells. You can configure “Quality Gates” to block a pull request if the new code introduces any critical issues.
- CodeClimate: Similar to SonarQube, CodeClimate automates code review and gives you a clear maintainability score. It even assigns a simple letter grade (A-F) to files, which makes setting a pass/fail threshold incredibly straightforward.
- Custom Scripts or GitHub Actions: If you want total control, you can always write your own checks. A common one I’ve seen is a custom GitHub Action that runs a complexity analysis and fails the check if any single function has a Cyclomatic Complexity score over 10.
If you’re still getting familiar with how all this works, our guide on what is continuous integration is a great place to start. It breaks down how these automated processes are the backbone of any modern development team.
A Practical Example: The Deployment Checklist
The best way to ensure quality is to make it a repeatable, checkable process. Developers need practical tools to get things done right. Here’s a prompt you can give to an AI assistant (or use as a manual checklist) to confirm a deployment is truly production-ready.
✅ Prompt
“Checklist: confirm my Astro site is deployed on Cloudflare Workers with best-in-class performance, SEO, and DX. Verify adapter, asset storage, caching, hydration, and SSR/SSG choices. Give me a clear yes/no on each item and point out fixes if something’s missing.”
📝 Example Response
Astro on Cloudflare Workers — Deployment Checklist
- Adapter → Using
@astrojs/cloudflareor@astrojs/cloudflare/worker? → ✅ Yes - Static vs SSR → Static pages prebuilt + only SSR where required (API, auth, etc.) → ✅ Yes
- Cold start avoidance → Worker bundle < 1MB, no heavy deps → ✅ Yes
- Assets → Offloaded to R2 / Cloudflare Images, not bundled in Worker → ❌ No → Fix: move images to R2 and rewrite URLs
- Caching → Edge cache headers set (
Cache-Control,stale-while-revalidate) → ✅ Yes - SEO → Title/meta tags verified, hreflang (if multilingual), robots.txt and sitemap.xml generated → ✅ Yes
- Core Web Vitals → Partial hydration configured, Lighthouse score >90 → ✅ Yes
- Global Edge → Tested from multiple PoPs (US/EU/Asia) for <100ms TTFB → ✅ Yes
- Limits → Worker within 30ms CPU budget, script <10MB → ✅ Yes
- Monitoring → Wrangler tail + Analytics enabled → ✅ Yes
Result: 9/10 checks passed. Only asset storage needs fixing.
This kind of specific, actionable checklist turns abstract quality goals into a concrete set of tasks, helping developers ship with confidence.
The secret to rolling this out successfully is to frame it as a helpful tool, not a gatekeeper. It’s a system designed to help everyone write better, more reliable code together by catching slips early and taking some of the pressure off manual code reviewers.
Answering Your Top Code Quality Questions
As you get serious about tracking code quality, you’re going to run into some tricky situations and nuanced questions. It’s totally normal. Let’s walk through some of the most common ones I’ve heard from teams over the years and get you some clear, practical answers.
What Is a Good Starting Point if We Measure Nothing?
If you’re starting from a blank slate, the worst thing you can do is try to track everything at once. You’ll just overwhelm your team and the data will be meaningless noise.
My advice? Start small. Pick one or two metrics that are easy to grasp and have a real impact.
A great first choice is Cyclomatic Complexity. It’s a fantastic indicator of how tangled and difficult a piece of code will be to maintain down the line. Pair that with a straightforward test coverage goal—don’t aim for perfection, just a solid baseline like 70% line coverage.
The trick is to keep it simple, automate the measurement process with a static analysis tool, and let your team get comfortable with the feedback before you start adding more metrics into the mix.
How Should We Measure AI-Generated Code Quality?
This is a big one now. When you’re dealing with code from tools like GitHub Copilot, you need to adjust your thinking slightly. The classic metrics still have their place, but the human element becomes even more important.
Rigorous human review is non-negotiable. During code reviews, focus on asking these questions:
- Can another developer easily understand what this code is doing and debug it?
- Does it properly account for edge cases, or is it just a “happy path” solution?
- Does it fit with our existing project conventions and architectural patterns?
Treat AI-generated code like a first draft from a brand-new junior developer. It’s a great starting point, but it needs to be carefully reviewed, tested, and validated to make sure it’s not just working, but also maintainable and secure.
Don’t just glance at it; scrutinize the logic, check the dependencies it pulls in, and think hard about any potential security holes before you merge it. We’re seeing that while AI can boost productivity, it can also introduce more code churn if engineers aren’t being vigilant.
Does High Test Coverage Guarantee Good Quality?
Absolutely not. This is a classic trap that a lot of teams fall into. High test coverage is a good sign, but it’s definitely not a magic bullet for quality.
All a coverage number tells you is what percentage of your code was touched by your test suite. It says nothing about the quality or usefulness of those tests. I’ve seen teams hit 100% test coverage with tests that had zero actual assertions—they just ran the code without checking if it did the right thing.
Think of coverage as just one data point in a much larger picture. You need to combine it with maintainability metrics, performance data, and—most importantly—the qualitative feedback that comes from thoughtful peer reviews to get a real sense of your codebase’s health.
Ready to turn these principles into action? Zest gives you the visibility to see how your team is using AI, turning daily coding activity into real insights that help you improve. Start measuring what truly matters and build a culture of quality. Learn more at https://meetzest.com.
Gallery
Lemon shots



