
How Do You Measure Velocity in Agile?

In Agile, we measure velocity by looking at the average amount of work a team gets done over a specific time, like a two-week sprint. This is usually tracked in story points—a way to estimate effort, not hours—to help forecast what the team can handle in the future. The real goal here is predictability, not just raw speed.
So, What Does Development Velocity Really Mean?
Before we get into the nuts and bolts of metrics, let’s clear up a common misconception. Velocity is a planning tool for the team, not a report card for management. I like to think of it less like a speedometer and more like a weather forecast. It uses past data to give you a pretty good idea of what’s coming, helping you plan your journey with more confidence.
Ultimately, its main job is to help your team give a solid answer to that all-important question from stakeholders: “When will it be done?” When a team knows its average velocity, it can more accurately forecast how much work it can realistically commit to in upcoming sprints and give better estimates for those bigger, long-term projects.
It’s About Predictability, Not Productivity
Here’s where so many teams go wrong. Velocity gets treated as a direct measure of productivity. As soon as leaders start using it to compare teams or push for higher and higher numbers, the whole system breaks down. I’ve seen it happen: teams start padding their story point estimates or, even worse, cutting corners on quality just to make the metric look good. At that point, it’s completely useless.
The true value of velocity is in the honest conversations it starts about what a team can actually accomplish. A stable velocity—even one that wiggles a bit—is usually the sign of a healthy team working at a sustainable pace. Wild swings, on the other hand, are a red flag that something needs to be discussed in the next retrospective.
How to Calculate Your Baseline Velocity
Getting a baseline for your team’s velocity is actually pretty simple. In Agile software development, you just track the total story points for all the work a team fully completes in a sprint.
Let’s say over five two-week sprints, your team completes 28, 24, 31, 26, and 29 story points. The average comes out to 27.6 story points per sprint. This rolling average, typically calculated from the last 3-5 sprints, helps smooth out any bumps from things like holidays or a team member being out sick. This gives you a much more reliable number for planning what’s next. If you want a deeper dive, you can explore this detailed agile velocity guide.
Core Agile Velocity Metrics at a Glance
Here is a quick summary of the primary metrics used to measure velocity and their purpose in sprint planning.
| Metric | What It Measures | Primary Use Case |
|---|---|---|
| Story Points Completed | The total effort (in story points) of user stories fully finished within a sprint. | The foundational unit for calculating average velocity. |
| Average Velocity | The average number of story points completed over the last several sprints (usually 3-5). | Forecasting future sprint capacity and long-term project timelines. |
| Velocity Range | The highest and lowest velocity a team has achieved over a period. | Understanding the team’s best-case and worst-case sprint scenarios for risk planning. |
| Commitment Reliability | The percentage of committed story points that were actually completed in a sprint. | Assessing how well the team is estimating its capacity during sprint planning. |
These metrics work together to paint a clear picture, not just of how fast a team is moving, but how consistently they can deliver value.
Choosing Your Metric: Story Points vs. Cycle Time
When it’s time to measure velocity, you’ll quickly run into two main options: Story Points and Cycle Time. They both paint a picture of your team’s output, but they tell very different stories. The right choice really comes down to your team’s experience with Agile and what you’re trying to figure out.
Story Points are all about relative effort. They’re an abstract way for a team to say, “This task feels about twice as big as that one.” It’s a team’s internal currency for sizing up complexity and risk, which is incredibly useful for sprint planning. It helps answer that crucial question: “What can we realistically commit to in the next two weeks?”
Cycle Time, on the other hand, is anything but abstract. It’s a direct measure of wall-clock time—from the moment work starts on a task to the moment it’s completely done. This isn’t so much about planning capacity as it is about making your workflow as smooth and efficient as possible.
When to Use Story Points
If you have a new team or a group just getting their feet wet with Agile, story points are a godsend. The act of estimating together, usually with something like Planning Poker, sparks essential conversations. It forces everyone to talk through the complexities and exposes assumptions that might otherwise go unnoticed. It’s a fantastic way to build a shared understanding of the work.
As the team does this over a few sprints, their estimations get better, and their velocity becomes more predictable. That makes planning for the future a whole lot easier.
When to Lean on Cycle Time
For a more seasoned team, maybe one using Kanban or focused on a continuous flow of work, cycle time often provides deeper insights. If you’re trying to hunt down and eliminate bottlenecks, cycle time is your best friend. A consistently long cycle time on certain types of work is a huge red flag that something in your process is causing a jam.
For example, if tickets always seem to languish in “Code Review” for days on end, your cycle time data will make that problem impossible to ignore. It’s the perfect prompt to discuss your review process or how work is being shared. To get an even fuller picture, it’s worth exploring other software engineering productivity metrics that can complement this approach.
This visual helps clarify when to use velocity as a planning tool versus when it’s just a performance report card.
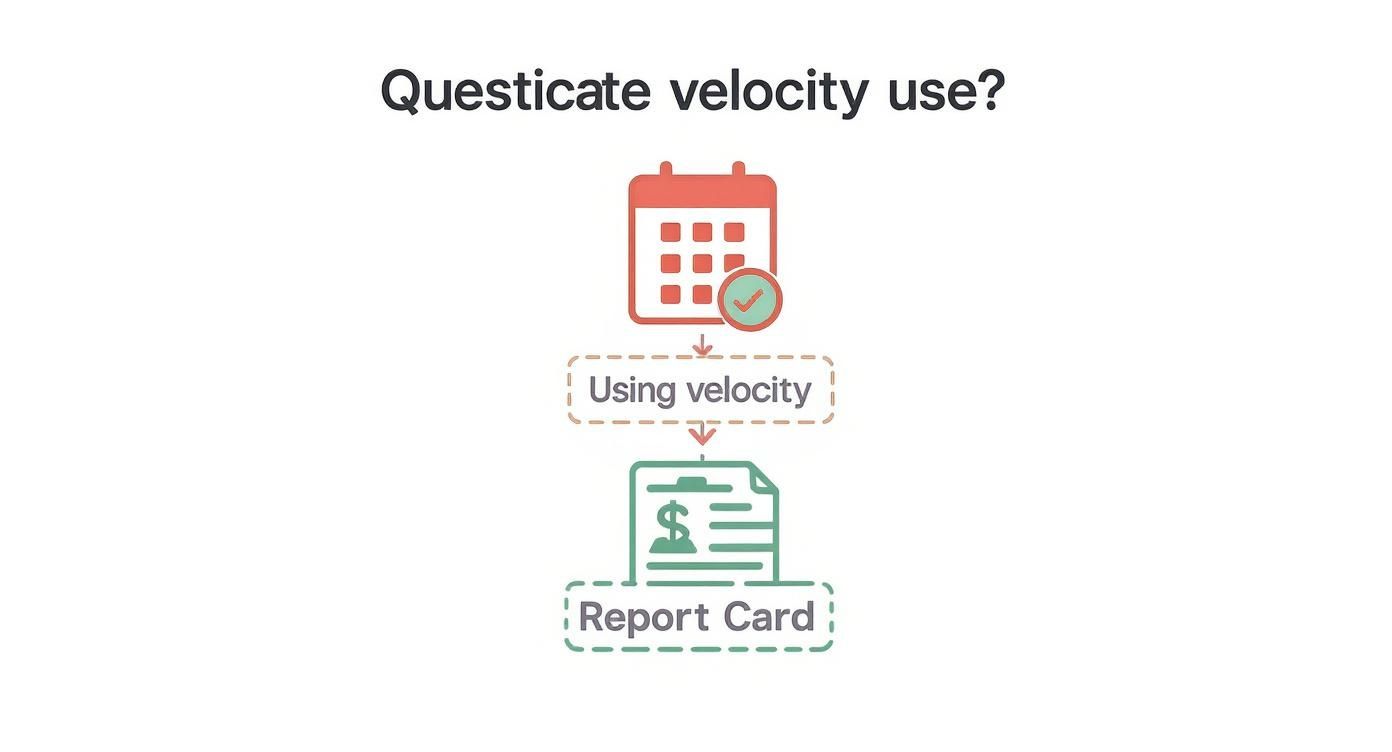
The big takeaway? Velocity is for looking forward and planning, not for looking back and judging a team’s performance.
In my experience, most mature teams end up using a mix of both. They might lean on story points for high-level roadmap planning but dig into cycle time data during retrospectives to fine-tune their process. It’s not about picking one and sticking with it forever; it’s about using the right tool for the right job.
Setting Up Your Tools to Capture Velocity Data

Before you can measure velocity accurately, you need clean, consistent data. It all comes down to the classic GIGO principle—Garbage In, Garbage Out. If your data is messy, your metrics will be useless.
This means setting up your project management tools, like Jira or Azure DevOps, to do more than just track tasks. You need to configure them to reinforce the good habits that lead to reliable numbers. The aim is for data capture to be a natural, automatic part of your team’s daily work, not a chore someone has to police.
Establishing a Rock-Solid Definition of Done
Your Definition of Done (DoD) is the bedrock of data integrity. Think of it as a strict, team-wide agreement on what it means for a story to be truly finished. It’s the checklist that must be completed before you can count the points.
Without a crystal-clear DoD, the meaning of “done” is open to interpretation, which makes your velocity numbers fluctuate wildly and ultimately become meaningless.
A solid DoD usually includes things like:
- Code Complete: The feature is coded and meets all acceptance criteria.
- Peer Reviewed: At least one other developer has reviewed and approved the code.
- Tests Passed: All unit and integration tests are green.
- Deployed to Staging: The code is live in a pre-production environment.
- QA Approved: The QA team has tested and signed off on the feature.
This checklist ensures that every story point represents a consistent chunk of real, delivered value.
A common mistake I see is teams letting tickets sit in the wrong column. If a story is marked “Done” but is still waiting on a code review, you’re wrecking your cycle time and velocity data. Your board has to be the single source of truth, period.
Configuring Your Board for Automatic Tracking
Once your workflow is defined, make your board enforce it. Configure your columns and automations to do the heavy lifting. A great example is connecting your Git repository to your board. When a developer opens a pull request, the associated ticket can automatically move from “To Do” to “In Progress.” This simple automation cuts down on manual errors and keeps your data sharp.
The other piece of the puzzle is a consistent estimation process. Whether your team uses Planning Poker or another technique, consistency is what matters most. A 5-point story this sprint should represent a similar amount of effort as a 5-point story next sprint.
One of the biggest mistakes you can make is changing a story’s point value mid-sprint. It’s tempting, but don’t do it. Once a sprint begins, the estimates are locked. If new work is discovered, it becomes a new story for the backlog. This discipline is crucial for preventing scope creep from silently inflating your velocity and giving you a false sense of progress.
Using Velocity for Predictable Forecasting
Once you have a few sprints of data, your velocity metric really starts to shine. It stops being just a number and becomes an incredibly useful tool for forecasting. The secret is finding a stable, predictable pattern.
Instead of getting hung up on one sprint’s number, I always recommend calculating a rolling average of the last 3-5 sprints. This simple trick smooths out the inevitable peaks and valleys, giving you a much more reliable baseline for what’s coming next.
If your average velocity works out to be 30 story points, that’s your starting point. It gives you a solid, data-backed foundation for your next round of agile development sprint planning. This way, you’re not just guessing; you’re helping your team commit to a workload they can actually handle.
Reading the Story Your Data Tells
The real magic happens when you start digging into the why behind the numbers. A velocity chart isn’t just a graph; it tells a story about your team’s journey.
A sudden, sharp drop isn’t a failure—it’s a signal to get curious. Was there a massive, unexpected bug that pulled everyone away from their planned work? Is some hidden technical debt grinding things to a halt?
On the flip side, a big spike in velocity might mean the team overestimated how complex the work was. That’s not a bad thing! It’s actually a great piece of feedback for getting better at estimation next time. These are exactly the kinds of conversations you should be having in your retrospectives.
One of the biggest mistakes I see is when teams present a single, absolute number for velocity to stakeholders. This sets a dangerous precedent, creating an expectation of perfect predictability that just isn’t realistic in software development.
Presenting a Velocity Range
To build trust and manage expectations properly, always talk about your forecast as a range. It’s far more honest and useful.
If your team’s velocity has bounced between 25 and 35 points over the last few sprints, then that is your forecast. You can confidently tell stakeholders, “Based on our recent performance, we expect to deliver between 25 and 35 points of value in the upcoming sprint.”
This approach does two crucial things:
- It’s honest. It embraces the natural ebb and flow of development work.
- It’s useful. It gives everyone a realistic best-case and worst-case scenario for planning.
When you communicate in ranges, you shift the focus from hitting a specific, arbitrary number to consistently delivering value within a predictable band. This builds a much healthier, more collaborative relationship with everyone involved.
Making Velocity Tracking Smarter with AI and Automation

Let’s be honest: tracking velocity by hand is a grind. It’s not just tedious; it’s also error-prone. You’re usually looking at a snapshot of the past, not what’s happening right now. This is where the new wave of AI-driven workflow tools completely changes the game.
These platforms plug right into the tools your team already uses every day—GitHub, Jira, Slack, you name it. They automatically pull in way more than just story points, gathering rich data from every corner of your development process. This gives you a clear picture of what’s going on without adding any administrative overhead for your engineers.
More Than a Report Card—A Live Health Monitor
Instead of just tallying up what got done last sprint, these tools give you a live pulse on your entire development lifecycle. They can automatically track crucial metrics that tell a much bigger story about your team’s health and efficiency.
You get a constant stream of insights on things like:
- Cycle Time: The real, a-to-z time it takes for an idea to go from the first line of code to being live in production.
- Deployment Frequency: A simple but powerful metric—how often are you actually shipping code?
- Code Churn: How much code is being rewritten or deleted shortly after it’s committed? This is often a red flag for quality problems.
- PR Throughput: Is your review process a well-oiled machine or a bottleneck? This metric tells you instantly.
This automated approach shifts your perspective from looking in the rearview mirror to watching the road ahead. Many modern developer tools are even building these capabilities directly into their platforms. If you’re curious about this, check out our guide to the best AI coding assistants that are leading the charge.
What I find most powerful about using AI here is its ability to connect the dots. An AI tool might flag a sudden dip in velocity and immediately show you it’s correlated with a surge in bug-fix tickets for a new feature. That gives you an immediate, data-backed starting point for a conversation.
This kind of proactive analysis means you can jump on problems as they pop up, not wait until the retrospective two weeks later. When you automate the data collection, your team gets to spend less time on spreadsheets and more time doing what they love: building fantastic software.
A Developer’s Checklist for Technical Health
Here’s a practical, developer-focused checklist you can use to confirm a deployment is truly done and optimized. This example is for an Astro site on Cloudflare, but you can adapt the principles for any tech stack. It turns abstract goals like “performance” and “good DX” into a concrete set of verifiable tasks.
✅ Prompt
“Checklist: confirm my Astro site is deployed on Cloudflare Workers with best-in-class performance, SEO, and DX. Verify adapter, asset storage, caching, hydration, and SSR/SSG choices. Give me a clear yes/no on each item and point out fixes if something’s missing.”
📝 Example Response
Astro on Cloudflare Workers — Deployment Checklist
- Adapter → Using
@astrojs/cloudflareor@astrojs/cloudflare/worker? → ✅ Yes - Static vs SSR → Static pages prebuilt + only SSR where required (API, auth, etc.) → ✅ Yes
- Cold start avoidance → Worker bundle < 1MB, no heavy deps → ✅ Yes
- Assets → Offloaded to R2 / Cloudflare Images, not bundled in Worker → ❌ No → Fix: move images to R2 and rewrite URLs
- Caching → Edge cache headers set (
Cache-Control,stale-while-revalidate) → ✅ Yes - SEO → Title/meta tags verified, hreflang (if multilingual), robots.txt and sitemap.xml generated → ✅ Yes
- Core Web Vitals → Partial hydration configured, Lighthouse score >90 → ✅ Yes
- Global Edge → Tested from multiple PoPs (US/EU/Asia) for <100ms TTFB → ✅ Yes
- Limits → Worker within 30ms CPU budget, script <10MB → ✅ Yes
- Monitoring → Wrangler tail + Analytics enabled → ✅ Yes
Result: 9/10 checks passed. Only asset storage needs fixing.
Got Questions About Velocity? Let’s Clear Things Up.
Putting velocity into practice is one thing, but a lot of the same questions tend to crop up once you start tracking it. Let’s walk through some of the most common hurdles teams face.
Can We Compare Velocity Across Different Teams?
This is a hard no. It’s easily the most common and destructive way to misuse this metric.
Think about it: story points are a relative estimate, created by one specific team. A velocity of 30 for the platform team means something entirely different than a velocity of 50 for the mobile team. They have different skills, different codebases, and different problems to solve.
Comparing these numbers inevitably turns into a competition. Teams might feel pressured to inflate their estimates to “keep up,” which makes the metric completely useless for its real purpose: forecasting.
Velocity is for looking at your own team’s past performance to predict its future. It’s a mirror, not a leaderboard.
What if Our Velocity Hits Zero for a Sprint?
A zero-velocity sprint is a big deal. It’s a signal that something went seriously wrong, and you need to get the team together for a frank, no-blame retrospective. It means nothing your team worked on met your “Definition of Done.”
What could cause this? A few things come to mind:
- A major external roadblock stalled everything.
- A critical bug in production pulled the entire team into firefighting mode.
- The work was way more complex than anyone realized during sprint planning.
The point isn’t to point fingers. The goal is to figure out why it happened and put a plan in place to make sure it doesn’t happen again.
How Do Bugs and Tech Debt Factor In?
Bugs and technical debt are the silent velocity killers. Every hour spent fixing an old bug or wrestling with a clunky system is an hour not spent on planned features. This will, by definition, lower your velocity.
Experienced teams know this is part of the game. A good practice is to dedicate a portion of every sprint—maybe 20% of your capacity—to tackling this kind of unplanned work. If you see a steady decline in your velocity over a few months, it’s often a tell-tale sign that your tech debt is piling up and needs to be addressed head-on.
Ready to turn your velocity data into real-world wins? Zest is an AI coding workflow manager that automatically captures insights from your daily work in VS Code and Cursor. It helps you spot blockers, share effective prompts, and measure what’s really driving your team’s momentum. Start improving your AI-assisted coding for free at meetzest.com.
Gallery
Lemon shots



