
A Practical Guide to Mastering DORA Software Metrics

DORA metrics are a set of four key measurements that tell you how fast and stable your software delivery is. They give engineering teams a way to look at their performance with hard data, getting rid of guesswork and turning “I think we’re doing okay” into “here’s exactly where we stand.”
What Are DORA Software Metrics and Why They Matter

Think of your development team like a pit crew at a Formula 1 race. The goal isn’t just to change the tires quickly; it’s to get the car back on the track fast and in perfect condition. DORA metrics are your stopwatch and diagnostic tools. They measure both your speed and your reliability.
These metrics came out of Google’s DevOps Research and Assessment (DORA) team. Starting back in 2014, they began a massive research project to figure out what top-performing teams were doing differently. Fast forward to today, and their annual Accelerate State of DevOps Report is built on data from over 36,000 professionals, making it the definitive study in the field. It’s what established these metrics as the industry standard.
The Four Pillars of Performance
The DORA framework is built on four simple-sounding but powerful metrics. They’re designed to be used together, creating a balanced picture that stops teams from chasing speed while letting quality slip (or the other way around).
Here are the four key DORA metrics:
- Deployment Frequency (DF): How often do you successfully ship code to production? This is a straightforward measure of your team’s tempo and throughput.
- Lead Time for Changes (LT): How long does it take from the moment a commit is made until that code is running in production? This reveals the efficiency of your entire pipeline.
- Change Failure Rate (CFR): What percentage of your deployments cause a problem in production? Think service outages, critical bugs, or anything that needs an emergency hotfix. This is your core quality metric.
- Time to Restore Service (MTTR): When a failure does happen, how long does it take you to fix it? This shows how resilient your team is and how quickly you can bounce back from problems.
From Gut Feelings to Data-Driven Decisions
Before DORA, trying to measure engineering performance often felt like a fuzzy, subjective mess. This led to a lot of dead-end conversations and very little real progress. If you’re new to this world, getting a handle on a good beginner’s guide to DevOps can provide some great context for why these metrics are so important.
DORA changed the conversation by giving everyone—from engineers to VPs—a shared vocabulary based on data. Instead of debating whether a team feels productive, you can look at the numbers. These metrics create a clear line between the engineering team’s work and what the business actually cares about: moving faster, breaking things less, and keeping customers happy.
As we’ll dig into, these four metrics are the foundation for understanding and improving your team’s overall software engineering productivity metrics.
The Four Key DORA Metrics Explained
When you first hear about DORA, it’s helpful to think of the four core metrics as two balanced pairs: Speed and Stability. One pair tells you how fast you’re shipping value, and the other tells you how reliable that value is once it’s in your users’ hands.
Getting this balance right is everything. If you only focus on speed, you’ll likely ship a lot of broken code and burn out your team. If you only focus on stability, you might build a flawless product that’s delivered too slowly to compete. DORA gives you a framework for excelling at both.
Let’s dig into what each metric actually measures.
Measuring Delivery Speed and Throughput
The first two metrics are all about velocity. They answer a fundamental question: “How fast can we get an idea from a developer’s keyboard into production?”
1. Deployment Frequency (DF)
This one is exactly what it sounds like: how often does your team successfully release code to production? Think of it as your team’s delivery pulse. A high and steady pulse means you’re consistently delivering value.
Top-tier teams deploy code multiple times a day. This isn’t about being reckless; it’s about making the process so smooth and automated that shipping small, incremental changes becomes a routine, low-risk event. Infrequent deployments, on the other hand, usually mean you’re stuck with big, stressful, and risky releases.
2. Lead Time for Changes (LT)
This metric tracks the clock from the moment a developer commits code to the main branch to the moment that exact code is running successfully in production. It’s the total time it takes for a change to make it through your entire delivery pipeline.
A long lead time is a massive red flag. It shines a light on all the bottlenecks in your process—slow code reviews, clunky manual testing, or an inefficient CI/CD pipeline. Elite teams get changes from commit to deploy in under an hour.
Shortening this lead time is a game-changer. It means you can fix bugs faster, respond to customer feedback quicker, and experiment with new ideas without waiting weeks for the results.
Measuring Operational Stability and Quality
Now for the other side of the coin. These next two metrics provide the critical check on speed, ensuring that what you’re shipping is actually working. They answer the question: “When we push a deployment, how often do we break things?”
3. Change Failure Rate (CFR)
Your Change Failure Rate is the percentage of your deployments that cause a failure in production. A “failure” could mean an outage, a degraded service, or anything that requires an urgent fix like a rollback or a hotfix.
A high CFR is a clear sign your quality checks aren’t cutting it. Maybe your testing strategy has holes, your codebase is too fragile, or your manual deployment steps are prone to human error. Elite teams keep their CFR below 15%, which shows they’ve embedded quality into their entire workflow.
4. Time to Restore Service (MTTR)
Let’s be realistic—failures will happen. Even the best teams push a bad change now and then. The real test is how quickly you can recover. That’s what Time to Restore Service (sometimes called Mean Time to Recovery) measures.
This is the average time it takes to get things back to normal after a production incident. Whether it’s by rolling back a change, deploying a quick fix, or toggling a feature flag, a low MTTR proves your team has solid monitoring, alerting, and incident response plans. It’s the ultimate sign of a resilient system.
Before we dive into improving these metrics, let’s pull them all together for a quick overview.
The Four DORA Metrics at a Glance
This table gives you a simple summary of each metric, its category, and what it’s designed to measure.
| Metric | Category | What It Measures |
|---|---|---|
| Deployment Frequency | Speed | How often you successfully release to production. |
| Lead Time for Changes | Speed | How long it takes to get a commit to production. |
| Change Failure Rate | Stability | What percentage of deployments cause a failure. |
| Time to Restore Service | Stability | How long it takes to recover from a failure. |
Seeing them side-by-side makes it clear how they create a balanced picture of your team’s performance, pushing for both speed and quality.
How to Measure and Instrument Your DORA Metrics
Knowing what the four DORA metrics are is one thing, but the real magic happens when you start collecting the data. Instrumenting these metrics isn’t about adding a bunch of new, complicated tools. It’s about tapping into the systems your team already lives in every single day.
Think of it as transforming the digital exhaust from your development pipeline—all those commits, builds, and alerts—into clean, actionable signals. The goal is to connect the dots between your version control, CI/CD pipeline, and incident management tools to build a real-time view of your team’s delivery performance.
This is where you can see the classic tug-of-war between speed and stability in action.
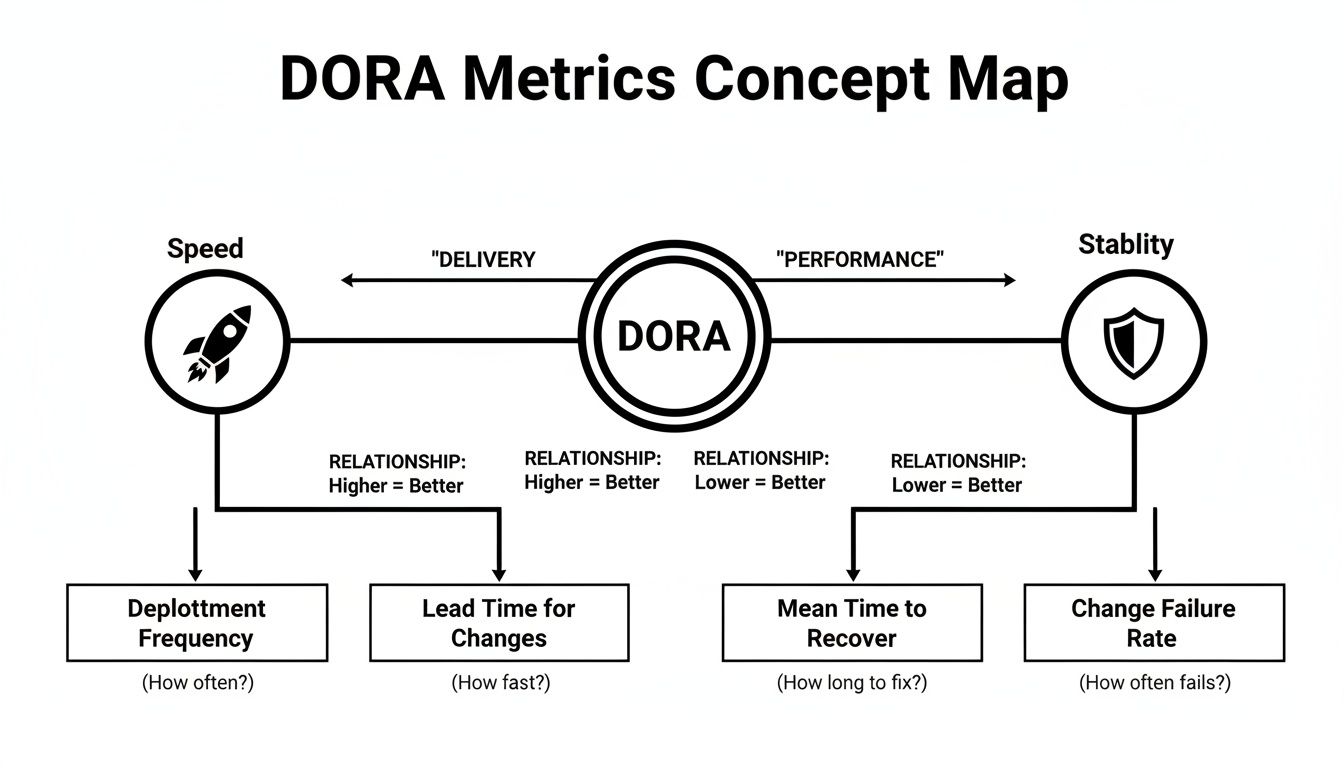
As the map shows, elite performance isn’t just about going faster. It’s about maintaining quality and reliability while you accelerate. The two go hand in hand.
Pinpointing Your Data Sources
To get numbers you can trust, you need to know exactly where to look. Each DORA metric has a primary source of truth, and it’s usually already in your toolchain.
Let’s break down where to find the signals you need:
- Deployment Frequency: Your CI/CD tool is the source here. Think GitHub Actions, Jenkins, or CircleCI. You simply need to count the number of successful deployments to your production environment over a given timeframe.
- Lead Time for Changes: This one requires connecting two dots. The clock starts with the “commit” timestamp from your version control system (like Git) and stops with the “successful deployment” timestamp from your CI/CD tool.
- Change Failure Rate: This metric often requires a bit of detective work. You’ll need to connect a production failure—often logged in an incident management tool like PagerDuty or Opsgenie—back to a specific deployment from your CI/CD system. A simple way to start is just by counting any deployment that results in an immediate hotfix or rollback.
- Time to Restore Service: Your incident management platform is the definitive source for this. You’re measuring the time from when a critical alert fires or an incident is declared to the moment it’s fully resolved.
The real goal here is automation. Tracking this stuff on a spreadsheet is a recipe for disaster. It’s not just tedious; it’s riddled with errors and inconsistencies that will quickly make your team lose faith in the numbers.
Common Pitfalls and How to Avoid Them
Jumping into DORA metrics, many teams stumble into the same few traps. Knowing them ahead of time can save you from a lot of headaches and misleading data.
One of the biggest mistakes is measuring “Lead Time for Changes” from the wrong starting point. A lot of teams start the clock when a Jira ticket is created. DORA is very specific: lead time starts at the first code commit. Measuring from the ticket creation mixes in your entire product discovery process, which masks bottlenecks that are specific to your engineering pipeline.
Another common pitfall is tracking failures too narrowly. A “failure” isn’t just a catastrophic outage. It’s any deployment that degrades service, throws errors, or forces you to ship an emergency patch. If you only count the big, headline-grabbing incidents, your Change Failure Rate will look amazing, but you’ll be blind to the real quality issues simmering under the surface.
Finally, you have to nail down consistent definitions. What is a “deployment”? Is it a push to staging or only to production? What qualifies as an “incident”? If every team has a different answer, your metrics become meaningless and you can’t compare apples to apples.
The Role of Modern Tooling
While you can absolutely stitch this data together yourself, modern tools can make it a whole lot easier. Engineering intelligence platforms are built for this, but even newer AI coding workflow managers like Zest are starting to capture valuable signals. These tools can automatically pull data from across the entire development process.
For example, an AI workflow manager can give you a better look at what happens before the first commit, shining a light on the “thinking time” that also contributes to your overall cycle. By spotting patterns in how engineers debug, research, and generate code, teams can find inefficiencies that traditional DORA instrumentation would completely miss.
Ultimately, effective instrumentation is all about creating a reliable feedback loop. Whether you build it yourself or buy a platform, the objective is the same: get trustworthy data that helps your team understand where they are today and have productive conversations about how to get better. For a deeper dive, you can explore other DevOps performance metrics that work well alongside DORA.
Interpreting Your DORA Performance Benchmarks
Once you have the raw numbers for your DORA metrics, the big question is always, “So… are we any good?” This is where the official benchmarks come into play. They aren’t just arbitrary goals; they’re data-backed profiles that sort teams into four distinct tiers: Elite, High, Medium, and Low.
Knowing where your team lands is the first crucial step. It gives you a baseline—a clear “you are here” marker on the map of software delivery performance. More importantly, it shows you what’s possible and points you toward a path for improvement. The goal isn’t just to slap an “Elite” label on your team, but to use these benchmarks as a compass for building healthier, more effective engineering practices.
Think of it less like a report card and more like a diagnostic tool. Your initial results might highlight strengths in stability but expose weaknesses in speed, or vice versa. That insight is gold because it helps you focus your energy right where it’ll make the biggest difference.
From Low Performers to Elite Teams
The leap from a low-performing team to an elite one is a story of deliberate, gradual change. It’s about moving away from slow, risky, and stressful deployments toward a smooth, predictable, and continuous flow of value. Each tier represents a major shift—not just in tooling, but in team culture and overall capability.
The 2023 Accelerate State of DevOps Report shared a powerful finding: teams that focus on user needs achieve 40% higher organizational performance. This proves that elite DORA performance isn’t just an engineering trophy; it’s about creating a system that can respond quickly and reliably to what your customers actually want.
Here’s a quick look at what that journey through the tiers feels like:
- Low Performers: These teams are often stuck with manual, infrequent deployments that feel like massive, all-hands-on-deck events. Lead times drag on for months, failures are common, and getting things working again is a slow, painful slog.
- Medium Performers: Teams here have started automating things but are still hitting bottlenecks. Deployments might happen weekly or monthly, and while they’re more stable than low performers, they haven’t yet built the confidence to ship changes on demand.
- High Performers: At this stage, automation is the default. Teams are deploying daily or weekly with a high degree of confidence. They bounce back from failures quickly and have a solid handle on their entire delivery pipeline.
- Elite Performers: For these teams, delivering software is a core strength. They deploy multiple times a day, on-demand. Their processes are so dialed in that shipping small changes is a low-risk, everyday activity, and they can restore service almost instantly.
DORA Performance Levels Elite vs Low Performers
To put a finer point on it, let’s look at a side-by-side comparison of the benchmarks that separate the best from the rest. This table really highlights the night-and-day difference in both speed and stability between Elite and Low-performing teams.
| Metric | Elite Performers | Low Performers |
|---|---|---|
| Deployment Frequency | On-demand (multiple times per day) | Less than once per month |
| Lead Time for Changes | Less than one hour | More than six months |
| Change Failure Rate | Less than 15% | 46-60% |
| Time to Restore Service | Less than one hour | More than one week |
The numbers are pretty staggering. An elite team can take code from a developer’s machine to production in under an hour, while a low-performing team needs more than half a year for the same journey. When something breaks, elite teams fix it in minutes, not weeks. This is a complete transformation in how software gets built and delivered. A great place to start improving is your team’s incident recovery process. You can learn how to calculate and reduce this in our guide on Mean Time to Resolve.
Practical Strategies to Improve Your DORA Metrics
Knowing your DORA metrics is one thing; actually improving them is where the real work begins. This isn’t just about chasing numbers. It’s about making smart, deliberate changes to your processes, tools, and culture to build a truly efficient and reliable software delivery engine.
The secret is to treat this as a series of small, manageable experiments. By focusing on specific strategies for each metric, your team can build a sustainable rhythm of continuous improvement and turn that raw data into real-world progress.
Boosting Speed: Deployment Frequency and Lead Time
To ship value to users faster, you have to shrink the time and effort it takes to get code from a developer’s laptop into production. Improving Deployment Frequency and Lead Time for Changes is all about removing friction from your delivery pipeline.
Think of your pipeline as a highway. To get more cars through smoothly, you need to clear the traffic jams, automate the toll booths, and make sure the on-ramps are clear.
Strategies to Increase Speed:
- Break Work into Smaller Batches: Massive, complex pull requests are a nightmare. They’re slow to review, hard to test, and incredibly risky to deploy. Push your team to work in small, incremental changes that can be merged and shipped in a day, not weeks.
- Optimize the Code Review Process: Let’s be honest, code reviews are often the biggest bottleneck. Set clear expectations for review turnaround times, use automated linters to handle the petty style debates, and build a culture where giving timely, helpful feedback is everyone’s job.
- Automate Your CI/CD Pipeline: Manual steps are slow, tedious, and begging for human error. The end goal should be a fully automated, hands-off path from commit to production. Investing in solid automation for testing, building, and deploying is simply non-negotiable for any team aiming for elite performance.
Implementing robust CI/CD best practices is foundational here. A mature pipeline builds the confidence you need to stop fearing the “deploy” button and start shipping on demand.
Enhancing Stability: Change Failure Rate and Recovery Time
Speed without stability is just a faster way to ship bugs to your users. Lowering your Change Failure Rate (CFR) and Mean Time to Recovery (MTTR) is about making sure that as you speed up, you don’t sacrifice quality or resilience.
This is all about building a safety net. You want a system where failures are rare, but when they inevitably happen, the blast radius is tiny and the fix is almost immediate.
Strategies to Increase Stability:
- Expand Automated Testing: Your test suite is your first and best line of defense. Go beyond the basic unit tests and include integration, end-to-end, and performance tests. A comprehensive test suite should give you rock-solid confidence that a change isn’t going to blow up in production.
- Implement Feature Flags: Feature flags (or toggles) are a game-changer. They let you deploy code to production without actually releasing it to all users. This decouples deployment from release, allowing you to test new features with a small audience and instantly kill them if something goes wrong. It’s one of the most powerful ways to slash your MTTR.
- Streamline Incident Response: When things break, every second counts. Having clear on-call schedules, smart automated alerting, and well-rehearsed incident response playbooks means your team can diagnose and fix issues calmly and quickly, without the chaos.
A proactive approach to stability is key. Don’t wait for a major outage to invest in better monitoring or testing. Build quality and resilience into your process from the very beginning.
The DORA framework itself continues to evolve, now including a fifth metric called Deployment Rework Rate. This research is built on nine years of data from over 36,000 professionals. While elite benchmarks—like on-demand deployments and sub-one-hour recovery times—are tough, the number of elite performers grew from 7% in 2018 to 26% in 2021. It proves these improvements are entirely achievable.
Ultimately, improving your DORA metrics is a journey, not a destination. By applying these practical strategies, you empower your team to not only move faster but to build better, more reliable software along the way.
Beyond the Metrics: Fostering a Culture of Improvement
It’s easy to get caught up chasing elite dora software metrics. But here’s the thing I’ve learned over the years: the numbers themselves aren’t the prize. Deployment frequency, lead time, and the rest—they’re the result of a healthy, high-performing engineering culture. Obsessing over a specific target without fixing the underlying system is like trying to cure a fever by sticking the thermometer in the freezer. It doesn’t work.
Truly elite performance grows from a foundation of psychological safety, a genuine commitment to learning, and blameless problem-solving. When your teams feel safe enough to experiment, to fail, and to learn from it all without fear of blame, they naturally start to innovate. The metrics simply start to reflect that positive environment.
Metrics as a Compass, Not a Weapon
The absolute fastest way to kill morale and trust is to weaponize DORA metrics. The moment they become a report card for performance reviews or a tool for stack-ranking teams, they’re corrupted. People will immediately start gaming the system, hiding failures, and optimizing for the number instead of the actual outcome. It’s a disaster for collaboration.
Instead, think of your DORA data as a compass. It’s there to help you start productive conversations, not to shut them down. The right way to use it is to spot trends and ask genuinely curious questions.
- “Hey team, it looks like our lead time is slowly creeping up. Any thoughts on what might be causing some friction in our pipeline lately?”
- “We had a couple more change failures this past month. What can we learn from those incidents to make our next deployment even safer?”
This simple shift changes the entire dynamic. It moves the focus from blame to collective ownership and shared problem-solving.
Cultivating Psychological Safety
Psychological safety is the bedrock. Without it, nothing else works. It’s that shared belief that the team is a safe place to take interpersonal risks—to admit you messed up, to ask for help, or to challenge an idea without getting your head bitten off.
When a deployment fails, the conversation in a psychologically safe team isn’t “Who broke this?” It’s “What part of our system allowed this to happen, and how can we make it stronger?” This blameless approach turns every single incident into a priceless learning opportunity.
Building this kind of environment takes real, deliberate effort from leadership. It means you have to celebrate the lessons learned from failures, not just the wins. It means encouraging honest dialogue in retros and always presenting data with context and empathy. When you get the culture right, the dora software metrics take care of themselves, reflecting a team that’s not just fast and stable, but also resilient, engaged, and built for the long haul.
DORA Metrics FAQ: Your Common Questions Answered
As teams start digging into DORA software metrics, a few questions always pop up. Getting these sorted out early is key to making the framework actually work for you, rather than accidentally creating problems.
Let’s walk through some of the most common ones I hear from engineering leaders.
Are DORA Metrics the Only Thing We Should Measure?
Nope. DORA metrics are fantastic for telling you how efficiently and reliably you build and ship software, but they don’t tell the whole story. They show the health of your engine, but not whether the car is heading in the right direction or if customers are enjoying the ride.
To get the full picture, you need to look at DORA alongside a few other types of measures:
- Product Value Metrics: Are people actually using what you build? Think feature adoption, user engagement, or even Net Promoter Score (NPS).
- Business Outcome Metrics: How does your work connect to the bottom line? This could be customer retention, conversion rates, or revenue.
- Operational Health Metrics: Is the system stable? Keep an eye on things like uptime, system availability, and error rates.
Think of DORA as one vital dashboard among a few.
Can We Use DORA Metrics to Compare Individual Developers?
This is a hard no. Seriously, don’t do it. This is probably the biggest and most destructive mistake a team can make with DORA.
DORA metrics are designed to measure the health and performance of a system—your processes, your tools, your team’s collaboration—not the output of an individual.
Trying to rank engineers with these numbers will only lead to resentment and fear. It encourages people to “game the system” by, for example, pushing lots of tiny, meaningless commits just to inflate their deployment frequency. It completely undermines the psychological safety you need for a team to innovate and take risks.
How Often Should We Be Looking at Our DORA Metrics?
The rhythm is more important than the exact frequency. For most teams, a good cadence is reviewing trends every two weeks or once a month, maybe during your regular team retrospectives.
This is frequent enough to catch important patterns before they become big problems, but not so often that you’re reacting to every tiny, meaningless blip. The idea is to look for the story the data is telling over time, not to micromanage daily fluctuations. Use these reviews to kickstart conversations about what’s going well, where the friction is, and what small experiments you can run to improve.
Ready to stop guessing and start measuring what matters? Zest is an AI coding workflow manager that automatically captures the signals you need to understand and improve your development process. Get visibility into your AI-assisted coding, spot bottlenecks, and share winning strategies across your team. Start for free at https://meetzest.com.
Level Up Your DORA Metrics
Turn raw data into a continuous improvement engine for faster, more reliable software delivery.
📊 Core DORA Metrics
- Deployment Frequency — How often you successfully ship code to production.
- Lead Time for Changes — Time from code commit to code running in production.
- Change Failure Rate — Percentage of deployments causing a production failure.
🕹️ My Cheatcodes
- 🌱 System, Not Individuals — Use DORA to measure system health, never to rank developers.
- 🦎 Balance Speed & Stability — Improve throughput metrics (DF, LT) and stability metrics (CFR, MTTR) together.
- ⚡ Automate Everything — Focus on automating the CI/CD pipeline to reduce bottlenecks and human error.
📈 Reflection Points
- 💡 Are we using metrics as a compass for conversation or a weapon for blame?
- 🧩 What is the single biggest bottleneck in our commit-to-deploy pipeline?
- 📘 Does our team feel psychologically safe to report failures and learn from them?
Gallery
Lemon shots



