A Guide to DevOps Performance Metrics

DevOps performance metrics are the vital signs of your software delivery pipeline. They give you a clear, honest look at the speed, quality, and stability of your engineering efforts, replacing guesswork with hard data to show you what’s working and what’s not. Ultimately, they help you strike that crucial balance between shipping fast and keeping your systems reliable.
Why DevOps Metrics Are Your Engineering Dashboard
In software, speed is king. But speed without stability is just a faster way to crash. This is precisely where DevOps performance metrics shine. Don’t think of them as a report card on individual engineers; see them as the master control panel for your entire engineering organization. They provide the essential signals you need to know if your development and ops practices are actually effective.
Without metrics, you’re flying blind. You might feel like your team is productive, but can you really answer these critical questions?
- How long does it take to get a new feature from an idea into our users’ hands?
- How often do our deployments cause bugs or system outages?
- When things do go wrong, how fast can we fix them?
- Are the changes we’re making to our process actually helping?
This isn’t about micromanaging or counting lines of code. It’s about getting a clear view of the whole system. The real magic happens when these metrics foster a culture of continuous improvement, empowering teams to make smart, data-driven decisions.
Introducing the DORA Metrics Framework
For a long time, the tech industry struggled to find a standard way to measure engineering performance. The breakthrough came from the DevOps Research and Assessment (DORA) team, whose multi-year research is now the gold standard. The 2023 Accelerate State of DevOps Report is the culmination of nine years of study, with data from over 36,000 professionals worldwide—making it the largest and longest-running analysis of its kind.
This research identified four simple but powerful metrics that get to the heart of software delivery performance. They’re so effective because they measure the entire system from end to end, perfectly capturing the natural tension between speed and stability.
The core idea is simple but profound: elite engineering teams do not sacrifice stability for speed. They achieve both simultaneously. High performance is about delivering value quickly and reliably.
To understand this balance, the four key DORA metrics are often grouped into two categories: throughput (how fast you go) and stability (how reliable you are).
This table breaks down the four core metrics and what they measure at a glance.
The Four Pillars of DevOps Performance
| Category | Metric | What It Measures |
|---|---|---|
| Throughput (Speed) | Deployment Frequency | How often your team successfully releases to production. |
| Throughput (Speed) | Lead Time for Changes | The time it takes for a committed change to reach production. |
| Stability (Reliability) | Change Failure Rate | The percentage of deployments that result in a production failure. |
| Stability (Reliability) | Mean Time to Restore (MTTR) | The average time it takes to recover from a production failure. |
By tracking these key DevOps performance metrics, you create a powerful feedback loop. It helps your team spot bottlenecks, celebrate progress, and consistently find better ways to deliver value to your customers.
The Four Core DORA Metrics Explained
If you want to understand the health of your software delivery pipeline, you have to move past gut feelings and into real, hard data. This is exactly where the DORA metrics come in. They give you a set of four interconnected data points that create a balanced view of how well your team delivers software—both quickly and reliably.
Let’s break down each one.
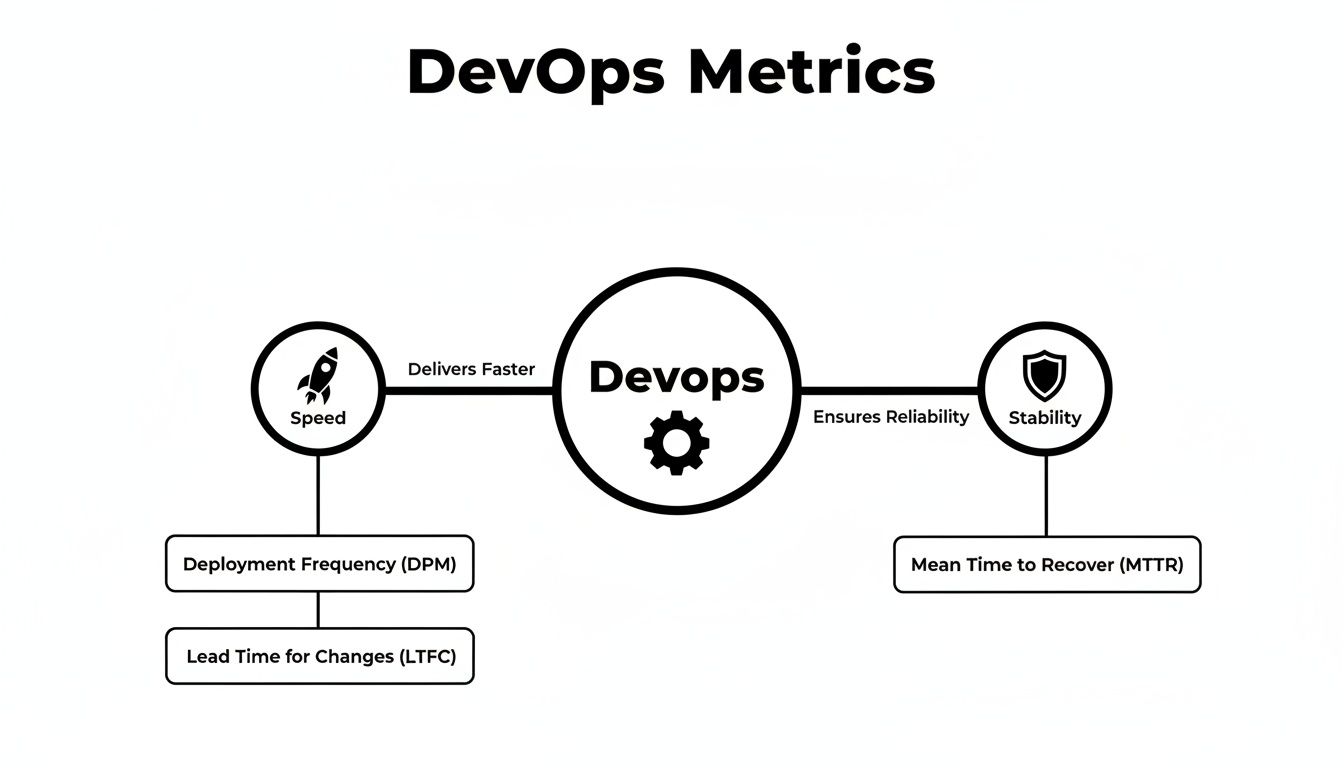
As you can see, high-performing teams don’t just focus on one area. They master both speed and stability, shipping code fast without compromising the reliability of their systems.
1. Deployment Frequency
Think of Deployment Frequency as the heartbeat of your development process. It simply measures how often your team successfully pushes code to production. A high frequency is a great sign. It doesn’t just mean you’re shipping more code; it shows you have a healthy, automated, and efficient pipeline humming along.
Imagine a factory. An elite factory can ship products multiple times a day because its assembly line is dialed in. A low-performing one might struggle to get a shipment out every few months, probably because it’s bogged down by manual steps and endless checks. The same is true in software—frequent, small deployments are far less risky and make it much easier to find the source of a problem when something breaks.
- Elite Performers: Deploy on-demand, often multiple times a day.
- Low Performers: Deploy somewhere between once a month and once every six months.
A high deployment frequency is a clear signal of mature CI/CD practices. If you’re new to DORA, we have a detailed guide on what DORA metrics are that you might find helpful.
2. Lead Time for Changes
While Deployment Frequency tells you how often you ship, Lead Time for Changes tells you how fast. This metric tracks the time from the moment a developer commits code to the moment that code is successfully running in production. It’s the true measure of how long it takes for an idea to become value for your customers.
A long lead time is a symptom of a bottleneck somewhere in your system. It could be slow code reviews, a manual testing phase that takes forever, or a complicated approval process. The 2023 DORA report actually pointed out that even if teams speed up code reviews, they won’t see overall improvement if other constraints exist down the line. It’s a reminder that improvement is a constant cycle of finding and fixing bottlenecks across the entire workflow.
- Elite Performers: Less than one day.
- Low Performers: Between one and six months.
This is a powerful metric because it reflects your team’s overall agility. Shrink this number, and your whole organization can respond to market changes and customer feedback that much faster.
3. Change Failure Rate
Speed is great, but it’s only half the story. The Change Failure Rate (CFR) is all about stability. It measures the percentage of your deployments that cause a problem in production, like degrading service or forcing you to roll back a change. It’s a direct look at the quality of your release process.
A high CFR is a red flag. It might point to issues with your testing, code reviews, or the deployment process itself. It’s a sign that your quality checks aren’t catching things or that your changes are just too big and complex to deploy safely.
A low Change Failure Rate isn’t about never failing. It’s about building a system so resilient and a process so solid that failures are rare and their impact is minimal.
- Elite Performers: 0-15% of changes fail.
- Low Performers: 46-60% of changes fail.
4. Mean Time to Restore (MTTR)
Look, no system is perfect. Things will break. When they do, the only question that matters is: how fast can you fix it? Mean Time to Restore (MTTR) measures the average time it takes to get things back online after a production failure.
A low MTTR is the sign of a resilient system and a well-prepared team. It shows you have strong monitoring and alerting in place and that your incident response practices are effective. It covers the entire process—from detecting the problem and figuring out the cause to shipping a fix.
- Elite Performers: Less than one hour.
- Low Performers: Between one week and one month.
Taken together, these four DevOps performance metrics give you a complete picture. They help teams see what’s working and what isn’t, turning software delivery from guesswork into a data-driven practice.
How to Measure and Instrument Your DevOps Metrics
Knowing what the key DevOps metrics are is the easy part. The real work starts when you try to actually measure them. This isn’t about buying a single new tool; it’s about connecting the dots across your entire software delivery lifecycle so you can see the full picture.

The goal here is to get away from manual tracking. Let’s be honest, spreadsheets are where good data goes to die. They’re slow, clunky, and almost always out of date. The good news is that all the data you need already exists in your core systems—your version control, CI/CD pipeline, and project management tools. You just need to tap into it.
Timestamping Key Events in Your Pipeline
The bedrock of any solid measurement strategy is timestamping. You need to record the exact time every important event happens in your development process. Think of it like a relay race—if you don’t know the exact moment the baton is passed, you can’t figure out which runner is slowing you down. It’s the only way to get a truly accurate read on metrics like Lead Time for Changes.
At a minimum, your system should automatically capture a timestamp for these four critical moments:
- Code Commit: The instant a developer pushes their code to the repository (like Git). This is the real starting gun for the delivery cycle.
- Build Success: When your CI server gives the green light on a successful build. This tells you the new code plays nicely with the existing codebase.
- Test Pass: The moment all your automated tests—unit, integration, the whole lot—come back clean. This is your most important quality check.
- Production Deployment: The finish line. This is the timestamp for when the code is live and in the hands of your users.
Once you start capturing these timestamps, you can instantly calculate the time spent between each stage. Bottlenecks that were once invisible will suddenly become crystal clear.
Automating Data Collection from Core Systems
I’ll say it again: manual data collection is a non-starter. Trying to pull numbers from three different systems into a spreadsheet isn’t just a waste of time; it’s a recipe for mistakes. Automation is the only way to track DevOps performance metrics reliably and consistently.
Treat metrics collection like you treat your code. It’s a first-class engineering problem that deserves an automated, reliable solution—just like your deployment pipeline.
This means getting your tools to talk to each other. Here’s a quick breakdown of where to get your data:
- Version Control (GitHub, GitLab, etc.): This is your source of truth for commit times, pull request merges, and all branching activity. You can use webhooks to fire off events to other systems as soon as code is pushed.
- CI/CD Tools (Jenkins, GitHub Actions, etc.): These tools are the heart of your instrumentation. They already track build times, test results, and whether a deployment succeeded or failed.
- Project Management (Jira, etc.): This is where you get the “why.” Linking commits back to specific tickets lets you trace a single feature from an idea all the way to delivery.
Choosing the Right Tooling for Visibility
Once you have your data sources sorted, you need a way to bring it all together, analyze it, and—most importantly—visualize it. If you’re just starting and want to understand the basic principles, you can learn a lot from guides on tracking operational performance indicators in Excel, even though you’ll quickly outgrow that approach.
For a modern DevOps team, you’ll need something more specialized. These tools generally fall into a few camps:
- Built-in CI/CD Analytics: Many platforms like GitLab now have dashboards that give you the core DORA metrics right out of the box.
- Value Stream Management (VSM) Platforms: Tools like Jira Align or Plutora are built for the big-picture view, helping you map the entire journey from business idea to customer value.
- Observability and Monitoring Tools: Solutions from Datadog or Middleware excel at connecting deployment events to actual system performance, which is vital for calculating MTTR. You can dive deeper into this specific metric in our guide on Mean Time to Resolution.
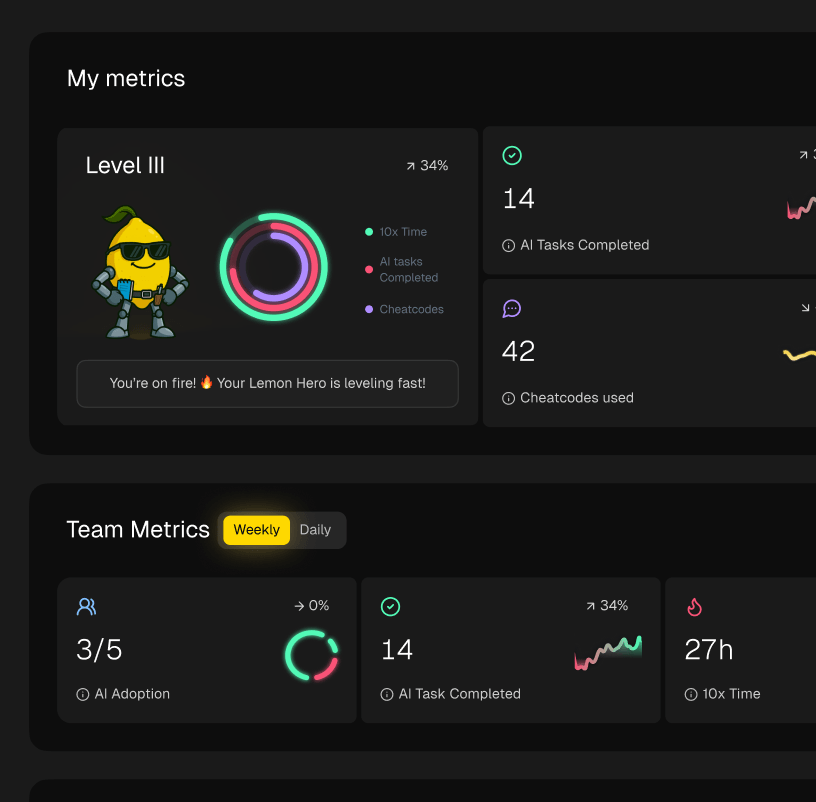
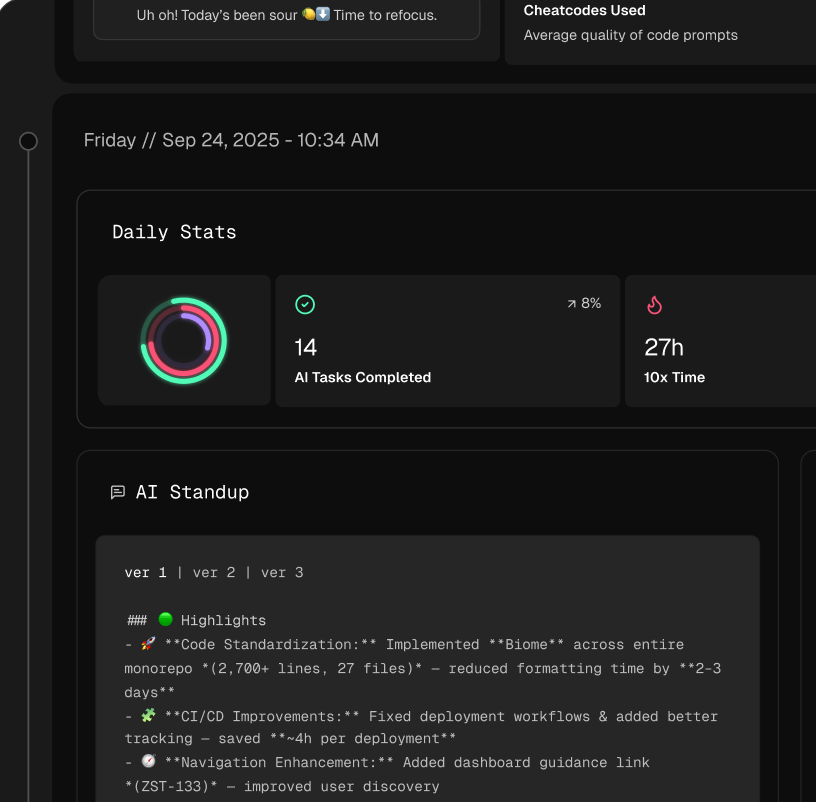
- Modern Workflow Managers: Tools like Zest drill down even further. They show how daily developer activities and AI-powered coding connect to those high-level metrics, linking what an individual does to the team’s overall results.
The perfect tool really depends on where your team is today and what you’re trying to achieve. The key is to start simple, automate everything you can, and make sure the metrics are visible to everyone on the team so they can actually be used to make things better.
Moving Beyond DORA with Additional Metrics
The four core DORA metrics are a fantastic starting point. They give you a solid, high-level snapshot of your delivery speed and stability. But they don’t tell the whole story.
Relying only on DORA is a bit like judging a car’s performance just by its 0-60 time and gas mileage. It’s useful, but what about the handling, the braking, or how it feels to actually drive? To get a complete picture of your engineering team’s health and performance, you have to look deeper.
This means pairing your DORA numbers with metrics that shed light on the health of your processes and, just as importantly, your people. After all, elite performance that comes from burning out your team isn’t sustainable. A myopic focus on DORA can unintentionally push teams to cut corners on quality, skip important reviews, or foster a high-pressure culture that eventually breaks.
The Importance of Process Health Metrics
Process health metrics help you understand the “how” behind your DORA scores. They’re diagnostic tools that point you to the root cause of a slowdown or a spike in failures.
Here are a few powerful examples:
- Cycle Time: This tracks the clock from the moment a developer starts working on a task to the moment it’s finished. While Lead Time for Changes measures commit-to-deploy, Cycle Time zooms in on the active development phase. If your Cycle Time is high, it’s often a sign of murky requirements, technical debt, or too much context switching. You can see how this fits into a bigger picture by exploring other software engineering productivity metrics.
- Code Review Efficiency: How long does a pull request (PR) just sit there waiting for a reviewer? How many rounds of comments does it take to get a merge? A slow or painful review process is one of the most common bottlenecks out there, and it’s a direct contributor to a longer Lead Time.
- Work in Progress (WIP): While not a metric in the traditional sense, keeping an eye on how much work is happening at once is crucial. High WIP is a classic symptom of an overloaded team struggling to focus, which ultimately hurts both speed and quality.
Don’t Forget the Human Element
Perhaps the most overlooked (and most important) set of devops performance metrics are the ones that gauge team health and satisfaction. A happy, engaged team is a productive team. It’s that simple.
Research from the 2023 State of DevOps Report shows this isn’t just a hunch. A healthy, generative culture correlates with 30% higher organizational performance. And teams that truly focus on their users see 40% higher performance. You can read the full findings on the impact of culture and user-centricity.
Measuring the human side can feel a little less concrete, but it’s absolutely essential. You can start by tracking:
- Developer Satisfaction Surveys: Simple, regular pulse checks can uncover friction points in your process long before they start dragging down your DORA numbers.
- Meeting Load: Are your engineers spending their days in meetings or do they have long stretches of uninterrupted time for deep work? Too many meetings is a notorious productivity killer.
Measuring the ‘Invisible’ Work of AI
There’s a new wrinkle in all of this: the rise of AI coding assistants. The time developers spend prompting, refining, and checking AI-generated code is a huge and growing part of their workflow.
This “invisible” work can have a massive impact on Cycle Time and code quality, but traditional metrics don’t see it.
This is where new tools like Zest come in. They’re designed to provide visibility into these AI-assisted workflows. By tracking things like time saved by AI, how effective prompts are, and how much AI-generated code needs to be reworked, you can finally understand how these tools are really affecting your team. This lets you quantify the return on your AI investment and figure out how to use it most effectively.
Turning Metrics into Meaningful Improvements
Collecting DevOps performance metrics is just the start. Let’s be honest, data sitting on a dashboard is useless unless it sparks a conversation and, more importantly, drives action. The real magic happens when you turn those numbers into a concrete plan for making things better. This is where you shift from just watching the game to actively steering your team toward the win.

The key is to stop thinking about improvements as massive, disruptive projects. Instead, treat them as a series of small, iterative experiments. When you systematically identify a problem metric, form a hypothesis about the cause, and test a solution, you build a culture of continuous learning and refinement that actually sticks.
Connecting Metrics to Actionable Scenarios
Every metric tells a story. A high Change Failure Rate isn’t just a number; it’s a symptom of a weak spot in your quality process. A sluggish Lead Time points to a bottleneck that’s frustrating your developers and making your customers wait.
Let’s walk through some common scenarios and map them directly to proven improvement strategies. Think of this as a practical diagnostic guide for your software delivery pipeline.
Mapping DevOps Metrics to Improvement Strategies
When a metric looks off, it’s often a signal of an underlying process issue. The table below connects common metric-related problems with potential root causes and, most importantly, actionable steps your team can take right away.
| Problem Metric | Potential Cause | Actionable Strategy |
|---|---|---|
| High Lead Time for Changes | Slow code reviews; PRs sit for days. Manual testing bottlenecks. | Instrument the PR process (time to merge, review cycles). Encourage smaller, focused PRs. Increase automated test coverage to reduce manual QA load. |
| High Change Failure Rate (CFR) | Inadequate automated testing. Pressure to ship quickly leads to skipped steps. Staging environment doesn’t mirror production. | Strengthen pre-deployment quality gates. Implement more robust integration and end-to-end tests. Use canary releases or feature flags to limit the blast radius of failures. |
| Low Deployment Frequency | Complex, manual deployment processes. Lack of CI/CD automation. Large, infrequent “big bang” releases. | Invest in CI/CD automation to make deployments a one-click process. Break down large features into smaller, independently deployable changes. |
| High Mean Time to Restore (MTTR) | Poor monitoring and alerting. No clear incident response plan. Manual rollback procedures. | Implement comprehensive observability tools (Prometheus, Grafana). Create and practice an incident response runbook. Automate rollback processes. |
This isn’t about blaming individuals; it’s about diagnosing the system. By connecting the symptom (the metric) to the cause, you can focus your energy on changes that will have a real, measurable impact.
A Framework for Continuous Improvement
Fixing a single metric isn’t the end goal. The real aim is to build a system where the team can consistently identify and solve its own problems. That requires a structured, repeatable approach.
Treat your improvement efforts like you treat feature development. Define a hypothesis, run a small experiment, measure the results, and iterate. This scientific approach removes guesswork and ensures real progress.
Here’s a simple framework you can use over and over again:
- Identify the Pain Point: Look at your metrics dashboard together as a team. Which number is heading in the wrong direction or causing the most frustration?
- Form a Hypothesis: Brainstorm potential causes. Don’t just accept the first answer—dig deeper to find the root cause. “Our builds are slow” isn’t as good as “Our builds are slow because the integration test suite is inefficient.”
- Define a Small Experiment: Propose a specific, time-boxed change to test the hypothesis. For example, “For the next two weeks, we will optimize the three slowest tests and see if it reduces overall build time.”
- Measure the Impact: After the experiment, look at the data again. Did the metric improve? What was the qualitative feedback from the team?
- Adopt, Adapt, or Abandon: Based on the results, you can decide to make the change permanent, tweak the experiment and run it again, or scrap it and try a different approach.
This cycle transforms your DevOps performance metrics from a static report card into a dynamic, interactive guide. It empowers your team to take ownership of their process and continuously get better.
Common Mistakes to Avoid with DevOps Metrics
If you’re not careful, the very metrics meant to help your team improve can backfire. They can create friction, fear, and a culture of finger-pointing. It’s a classic case of good intentions gone wrong, and even the best teams can stumble into these traps.
The key is to remember what these metrics are for: they’re a flashlight, not a weapon. Their job is to shine a light on system-wide problems and start a conversation about how to fix them. They should never be used to blame individuals. When your team feels safe to experiment and learn, that’s when you’ll see real, lasting progress.
Weaponizing Metrics Against Individuals
This is the cardinal sin of DevOps measurement. The moment you tie metrics like Deployment Frequency or Change Failure Rate to an individual’s performance review, you’ve already lost.
Once people feel their job or bonus is on the line, they’ll stop focusing on delivering value and start optimizing for the metric. This is called “gaming the system,” and it leads to all kinds of bad habits:
- Pushing out tiny, insignificant code changes just to bump up the deployment count.
- Dodging risky but important projects because of the fear of failure.
- Playing the blame game when something inevitably breaks.
Your metrics should be a flashlight, not a hammer. Use them to find bottlenecks in your process and see where the system is failing. It’s always about fixing the system, not blaming the people who are doing their best to work within it.
Focusing on a Single Metric
It’s easy to get tunnel vision and fixate on just one number. Maybe you’re laser-focused on pushing Deployment Frequency higher and higher. But if you aren’t also watching your Change Failure Rate, you’re flying blind. Sure, you’re shipping code faster, but you’re also shipping more bugs and causing more headaches for your users.
There’s a reason the DORA metrics come as a set. They’re designed to create a healthy balance between speed and stability. Pushing for speed shouldn’t come at the cost of quality, and vice versa. Looking at all the metrics together ensures you’re improving the whole picture, not just one small corner of it.
Comparing Teams Without Context
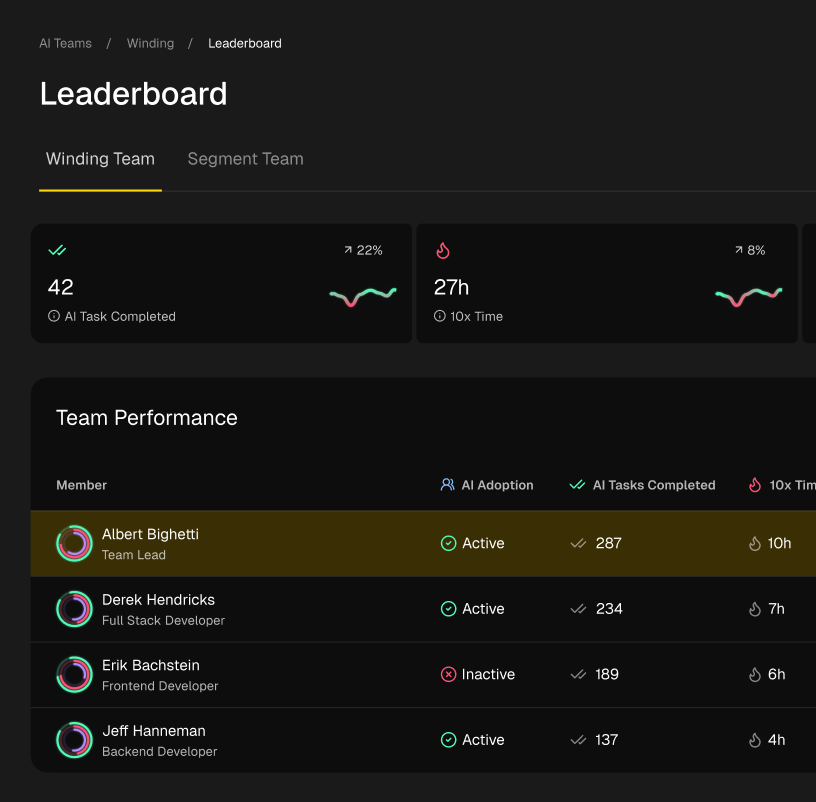
Setting up a DORA metrics leaderboard to pit teams against each other might seem like a good way to spark some friendly competition. In reality, it’s almost always a terrible idea.
Think about it: every team is different. One team might be wrestling with a 10-year-old legacy system, while another is building a brand-new service from scratch. Their metrics are going to look completely different, and that’s perfectly normal. Comparing them directly is like comparing apples to oranges—it’s meaningless and demoralizing.
The only comparison that matters is a team’s performance today versus its performance last month. The goal is internal improvement. Are we getting better? When you frame it this way, metrics become a tool for collaboration and learning, creating a positive cycle that lifts everyone up.
Got Questions About DevOps Metrics? We’ve Got Answers.
Even with a solid grasp of the core metrics, things can get tricky when you start trying to apply them in the real world. Let’s tackle some of the most common questions that pop up when teams first start measuring their performance.
Where Should a New Team Even Start?
If you’re just dipping your toes in the water, keep it simple. Seriously. Don’t fall into the trap of trying to measure every single thing right out of the gate.
A great starting point is to focus on just two of the DORA metrics: Deployment Frequency and Lead Time for Changes. These two give you a fantastic, balanced snapshot of your team’s overall throughput, and they’re usually the easiest to track using data you already have in Git and your CI/CD pipeline. Once you get comfortable with those, then you can start layering in Change Failure Rate and MTTR.
Okay, So Which Metric Is the Most Important?
This is a trick question! There isn’t a single “most important” metric. Their real power comes from looking at them together, as a complete picture.
Focusing on just one metric almost always backfires. For example, if you push the team to increase Deployment Frequency but ignore the Change Failure Rate, you’re basically asking for a firehose of rushed, buggy releases. It’s a recipe for disaster.
The real goal is balance. Elite performers don’t just ace one metric; they excel across all four DORA metrics at the same time. This proves that speed and stability aren’t opposing forces—they’re the natural result of a well-oiled engineering system.
How Often Should We Be Looking at This Data?
You want to review them regularly, but not so often that you’re just reacting to random noise. A healthy rhythm is to glance at the trends in your weekly team meetings and then dive deeper during your monthly or quarterly retrospectives.
This cadence helps you:
- See the real trends over time instead of panicking over one bad day.
- Connect the dots between a change in a metric and a specific process improvement (or a recent incident).
- Keep the data front and center in your team’s conversations about getting better.
The most important thing is consistency. Make checking your DevOps metrics a regular, blameless habit for the whole team.
Ready to see how your team’s AI-assisted workflows are performing and connect that day-to-day activity to real DevOps outcomes? Zest can help you turn your metrics into clear, actionable insights. Get started with Zest today.
Master Your DevOps Metrics
Use this scorecard to transform raw data into a powerful, collaborative engine for continuous improvement.
📊 Core DORA Metrics
- Lead Time for Changes — The time it takes for a committed change to reach production.
- Deployment Frequency — How often your team successfully releases to production.
- Change Failure Rate — The percentage of deployments that result in a production failure.
🕹️ My Cheatcodes
- 🌱 Start Simple — Focus on just two metrics (Deployment Frequency, Lead Time) before tracking all four.
- 🦎 System, Not People — Use metrics as a flashlight to find process bottlenecks, not a hammer to blame individuals.
- ⚡ Balance is Key — Improve metrics as a set to avoid sacrificing stability for speed, or vice-versa.
📈 Reflection Points
- 💡 Are we weaponizing metrics against individuals instead of diagnosing the system?
- 🧩 Are we comparing teams without context, creating unhealthy competition?
- 📘 Do our tools automatically timestamp key events to ensure our data is accurate?
Gallery
Lemon shots