Top Guide: developer productivity metrics zest linear jira for modern teams
When you look at developer productivity metrics in Zest, Linear, and Jira, the main difference comes down to focus. Jira and Linear are all about project outcomes, while Zest zeroes in on the developer’s actual workflow as it happens. Your traditional tools tell you if a ticket got done. Zest shows you how it got done, including every AI interaction and hidden roadblock along the way.
Rethinking Developer Productivity Metrics In The AI Era

Software development has changed for good. AI coding assistants aren’t just a fun new toy; they’re a core part of how developers work now. This shift has created a massive blind spot for engineering leaders because the metrics we’ve always trusted are quickly becoming irrelevant.
Project management tools like Jira, and even its modern cousin Linear, were built before this AI wave hit. They are fantastic at tracking outputs—things like completed tasks, story points, and cycle times. But while that’s useful for keeping a project on the rails, it gives you absolutely no visibility into the process. It can’t answer the most pressing questions about how your team works today.
The Measurement Gap
This blind spot is where old-school productivity metrics fall apart. Engineering managers are left guessing about what’s really going on with their teams.
- AI Adoption: Is your team actually getting value from AI tools, or are they just wrestling with bad prompts?
- Workflow Friction: Where are the real bottlenecks? How much time is vaporized by context switching or debugging weird AI suggestions?
- Deep Work: What does a genuinely productive coding session even look like if it’s not just about closing a ticket?
Relying solely on Jira or Linear for productivity insights is like judging a chef only by the final dish, without knowing if they used a microwave or a Michelin-star kitchen. You see the result, but you miss the entire process, skill, and efficiency that created it.
To really get a handle on developer productivity today, you have to keep up with the evolving capabilities of AI and how it’s changing the day-to-day grind. This guide is about a new way of thinking that goes beyond tickets to give you a complete, accurate picture of your team’s performance. By understanding how Zest, Linear, and Jira each play a different role, you can build a measurement system that reflects the reality of coding with AI.
Key Differences In Measurement Philosophy
First things first, you have to understand what each tool was built to do. Their core purpose shapes the data they collect and the insights they offer.
| Tool | Primary Focus | What It Measures | Core Question Answered |
|---|---|---|---|
| Jira | Project Management | Tasks, Sprints, Velocity, Burndown | “Is the project on track?” |
| Linear | Issue Tracking & Momentum | Issues, Cycles, Team Velocity | “Is the team shipping efficiently?” |
| Zest | Developer Workflow | AI Usage, Focus Time, ‘Stuck’ Time | “How is the work actually getting done?” |
This isn’t about picking a winner. It’s about learning how to layer their insights. While there are many great AI productivity tools for developers, the real power comes from combining project data from Jira or Linear with the on-the-ground workflow intelligence from Zest. That’s how you get the complete picture.
Comparing The Measurement Philosophies Of Zest, Linear, And Jira
To pick the right tool, you first need to understand what it believes in. Zest, Linear, and Jira each have a totally different take on what “developer productivity” even means. They measure different things because they were built to solve different problems, hailing from different eras of software development.
Jira: The Project-Centric Veteran
Jira, a veteran of the agile movement, is fundamentally a project management tool. Its entire philosophy is built around project-centric measurement. The core question it answers is, “Is the project on schedule and within budget?”
Naturally, its metrics focus on outputs you can see at the project level:
- Velocity: Measures how much work a team gets done in a sprint, usually in story points.
- Burndown Charts: A visual countdown showing work completed against time, tracking progress toward a sprint goal.
- Control Charts: Shows the cycle time for issues, which helps predict when future work might get done.
These metrics are gold for program managers and stakeholders who need that 30,000-foot view of project health. But they tell you very little about the day-to-day reality of the developers doing the actual work.
Linear: A Focus on Team Momentum
Linear represents a modern evolution, shifting the focus from rigid project management to team momentum and flow. It was designed from the ground up to cut down on administrative hassle and help teams ship faster.
Linear’s metrics are more refined, zeroing in on the efficiency of the development process itself:
- Cycle Time: Measures the time from when work starts on an issue to when it’s completed, shining a light on bottlenecks.
- Lead Time: Tracks the total time from an issue’s creation to its resolution, including how long it sat in the backlog.
- Team Velocity: A more direct measure of output, focusing on the number of issues completed rather than abstract points.
This approach is a huge step forward. It gives developers a cleaner experience that prioritizes continuous delivery and answers the question, “Is our team moving efficiently and without friction?” Still, it primarily measures the container for the work (the ticket), not the work itself.
Zest: A New Philosophy For The AI Era
Zest introduces a radically different, developer-centric philosophy built for how we code now, with AI assistants in the mix. It operates on the belief that to really understand productivity, you have to measure the coding process itself—all the little activities that traditional tools are completely blind to.
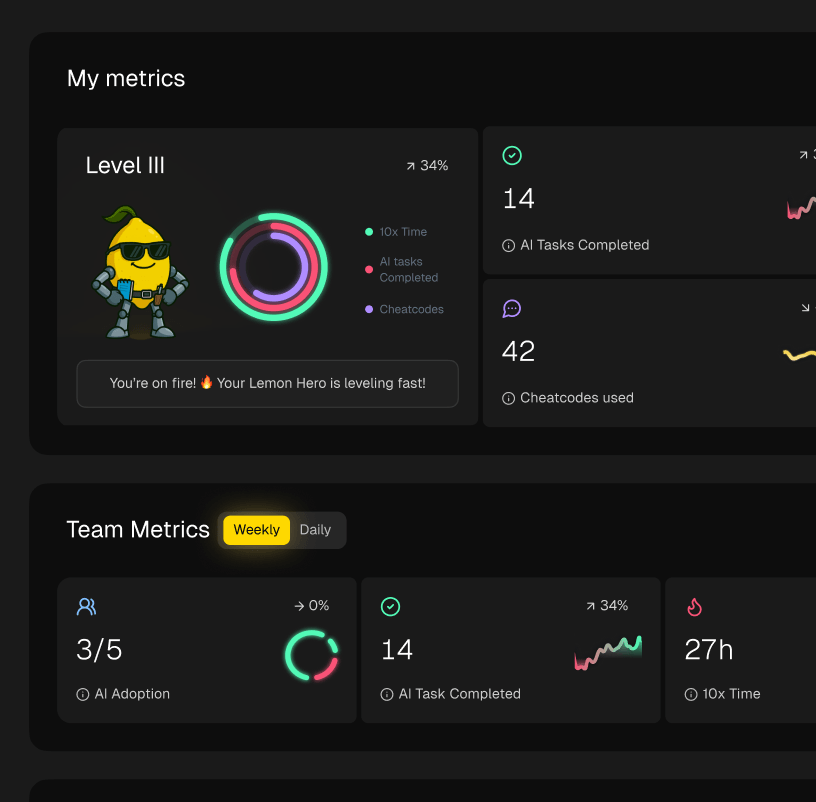
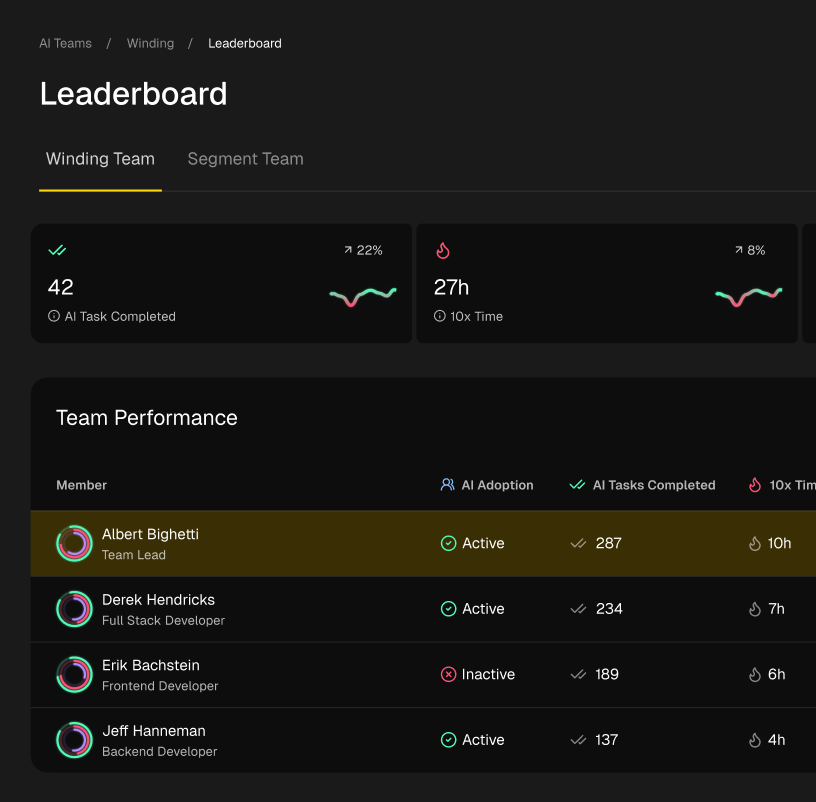
Zest gives you a ground-level view by capturing data points that were previously invisible. This screenshot from the Zest platform shows exactly how it visualizes a developer’s workflow, including time spent in different apps and interacting with AI.
This granular data allows Zest to surface metrics directly tied to a modern developer’s actual experience, providing context that project management tools just can’t offer.
Zest answers the question, “How is the work actually getting done?” It moves the focus from the ticket’s journey to the developer’s journey, capturing the nuance of deep work, AI collaboration, and those moments of being stuck.
This shift is critical. According to a recent JetBrains report, a staggering 66% of developers feel that current metrics fail to capture their true contributions. This is pushing engineering leaders to look beyond old-school metrics like build times and velocity.
The Zest philosophy isn’t about replacing Linear or Jira. It’s about complementing them by adding a much-needed layer of workflow intelligence. By understanding these software engineering productivity metrics, teams can finally connect the dots between how developers work and the outcomes they produce.
Metric Philosophy Comparison Zest vs Linear vs Jira
To put it simply, each tool is asking a different fundamental question about productivity. This table breaks down their core focus.
| Metric Focus | Zest | Linear | Jira |
|---|---|---|---|
| Primary Goal | Understand and improve the developer’s workflow and AI usage. | Optimize team momentum and the flow of work. | Manage project scope, schedule, and delivery. |
| Core Question | “How is the work getting done?” | “Is our team moving efficiently?” | “Is the project on track?” |
| What It Measures | Coding activities, AI interactions, focus time, and context switching. | Issue cycle time, lead time, and team output (issue count). | Story points, velocity, and progress against sprint goals. |
| Best For | Engineering managers and developers focused on improving coding habits and AI adoption. | Teams focused on continuous delivery and reducing process friction. | Program managers and stakeholders needing high-level project oversight. |
Ultimately, the right tool—or combination of tools—depends entirely on what you’re trying to measure. If project predictability is your main goal, Jira’s framework is essential. If you want to grease the wheels of your team’s process, Linear offers fantastic insights. But if you need to understand and improve how your team actually codes in the modern, AI-assisted world, Zest provides the ground-truth data that has always been missing.
A Deep Dive Into Measuring AI-Assisted Workflows With Zest
If Linear and Jira give you the 10,000-foot view of a project, Zest gets you on the ground, right in the code. It’s built for a different reality—one where developers are working hand-in-hand with AI assistants. Traditional project management tools simply weren’t designed to see what happens inside the editor.
Zest is all about measuring the process, not just the final output. It looks at how developers are actually interacting with AI coding tools, revealing insights that connect the dots between how productive your team feels and how they’re actually performing. This is a huge distinction. It’s common for developers to feel faster with AI, even when the data shows something else entirely.
This image really drives home the different measurement philosophies. You can see how Jira is all about the project, Linear is about momentum, and Zest digs into the actual workflow.
It’s clear that while the other tools track the “what” and “when,” Zest is built to explain the “how” and “why” behind your team’s work.
Uncovering the Real Impact of AI With Zest Metrics
Figuring out the real ROI on AI tools is one of the biggest headaches for engineering leaders today. There’s often a massive gap between perception and reality. For instance, a METR study discovered that early AI tools actually increased task completion time by 19% for experienced developers, which flew in the face of their own belief that they were working faster.
Zest cuts through the noise by delivering hard data on AI interactions. Its core AI Metrics give you a clear lens into what’s happening:
- Prompt Success Rate: How often does a developer’s prompt to an AI assistant actually produce useful, accepted code? This tells you if your team is getting value from the tool.
- Time Saved Per Interaction: Zest estimates the time saved by accepting an AI suggestion versus typing the code out manually, putting a tangible number on efficiency gains.
- AI Tool Effectiveness: You can compare different AI coding assistants to see which ones are truly delivering for specific tasks or teams.
These metrics go way beyond gut feelings. They give you a clear, data-backed picture of which tools are worth the investment and where your developers might need a bit more coaching. To go even deeper, check out our guide on the future of AI in software engineering.
Adding Qualitative Context With AI Standups
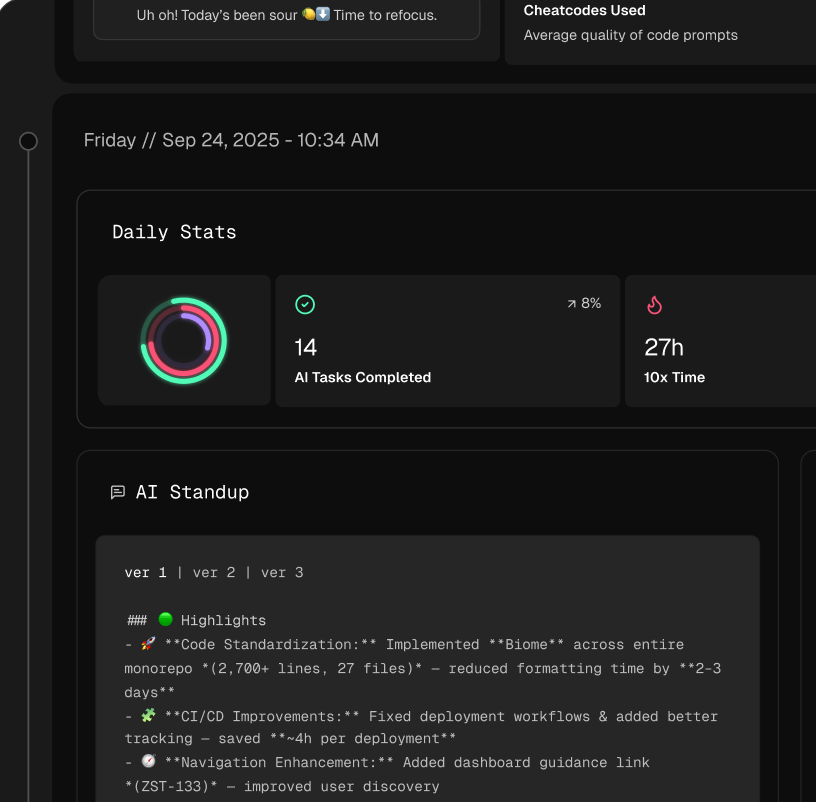
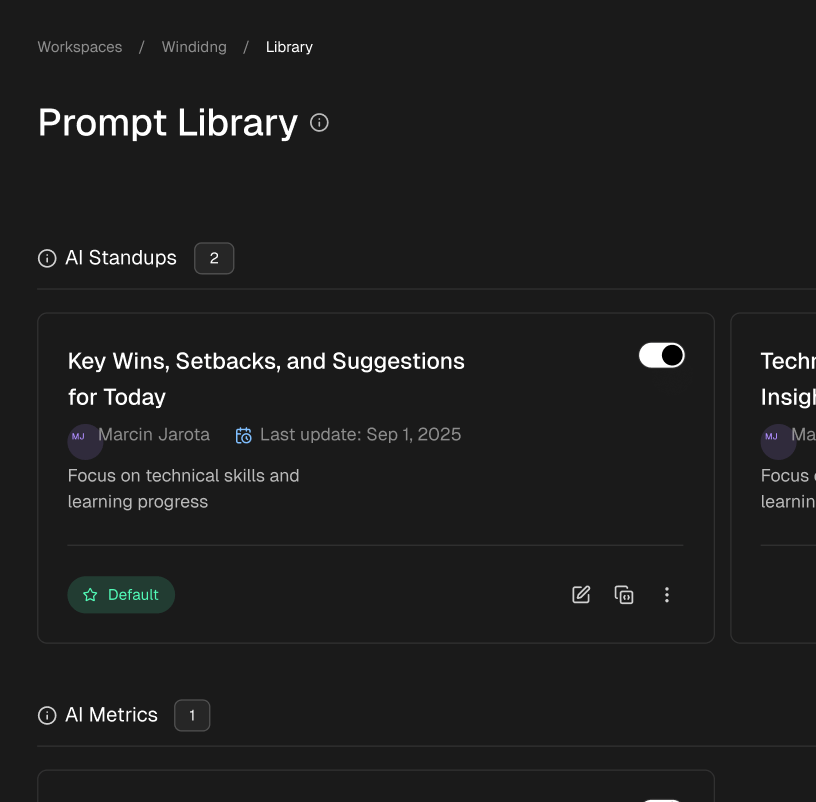
Of course, numbers alone never tell the full story. To really understand what’s going on, you need the qualitative context, and this is where Zest’s AI Standups feature is a game-changer. It automatically pulls together a daily summary of each developer’s day—their wins, where they got stuck, and what they focused on.
This automated summary means no more manual status updates, and it surfaces rich, contextual details that a Jira ticket or Linear issue could never hope to capture.
Think about it: instead of a vague “in progress” status, you might learn that a developer spent two hours battling an inefficient prompt, or that they found a clever new way to use an AI tool for refactoring legacy code. A simple status update suddenly becomes a powerful learning opportunity for the whole team.
Real-Time Coaching Through AI Hints
Zest doesn’t just help you analyze what happened yesterday; it provides real-time guidance to developers while they’re coding. The AI Hints feature works like an intelligent coach, spotting moments of friction and offering suggestions to improve the workflow.
AI Hints are designed to flag inefficient patterns in real time. For example, it can detect when a developer is repeatedly rephrasing the same prompt or has been stuck on a single file for an unusually long time without making progress.
This creates a proactive feedback loop that helps developers get back on track quickly. An AI Hint might suggest a better way to structure a prompt or point out that a developer seems to be context-switching a lot, which could signal a distraction. By catching these moments as they happen, Zest turns individual struggles into teachable moments and helps foster a culture of continuous improvement. This is the data that truly connects the high-level project view in Jira or Linear with the ground-truth of the coding experience.
How to Get the Full Picture by Integrating Zest with Linear and Jira
Think of Zest not as a replacement for your project management tool, but as a powerful sidekick. It fills in a crucial data gap. By integrating Zest’s micro-level workflow intelligence with the big-picture project tracking you get from Linear or Jira, you can finally see a complete, 360-degree view of how your team works. This combination helps you move past simple output metrics and build a far more accurate, nuanced story of your team’s performance.
The real goal here is to connect the how of the work (captured by Zest) with the what of the work (managed in Linear or Jira). When you bridge that gap, you start to see insights that were completely invisible before.
Tying Workflow Efficiency to Project Momentum
One of the best ways to use this integration is to correlate data sets to see if a new tool or process is actually working. By placing Zest’s workflow metrics right next to your project metrics from Linear or Jira, you can draw a straight line between what your developers are doing day-to-day and how your projects are progressing.
Let’s say you just introduced a new AI coding assistant to your team. Here’s how you can measure its real impact:
- From Zest: Keep an eye on the “AI Time Saved” metric for each developer. This gives you a direct look at the efficiency gains from the new tool.
- From Linear/Jira: At the same time, monitor the team’s Cycle Time or Lead Time for Changes.
If you see “AI Time Saved” steadily climbing in Zest while your cycle time in Linear is dropping, you have solid proof that the AI tool is delivering a positive ROI. That data-driven story is so much more powerful than just relying on what people say.
Combining these data sources lets you move from simply guessing at correlation to proving causation. You can confidently say, “Our investment in this AI tool led to a 15% reduction in average cycle time because our team is saving a collective 20 hours per week, according to Zest.”
This approach does more than just justify spending on new tech; it also shows you where AI adoption is having the biggest impact. You’re turning subjective feelings into a solid business case. In fact, research from DX across more than 300 organizations found that this kind of holistic view prevents teams from gaming the metrics and helps them refocus on high-value work, leading to 12% efficiency gains. You can read more about how top teams are finding these gains at Codeant.ai.
Adding Real-Time Context to Your Tickets
Another fantastic integration pattern is to use Zest’s qualitative insights to add rich, real-time context to your Jira tickets or Linear issues. Your project management tool might show a ticket as “in progress,” but that status tells you almost nothing about what the developer is actually going through.
This is where Zest’s AI Standups feature really shines.
Imagine a developer’s automated AI Standup summary flags a specific blocker: “Struggled for 2 hours with an authentication bug in the payment API.” With an integration, that crucial piece of information can be automatically linked to the right Jira ticket.
This simple connection turns a static ticket into a living, breathing document. An engineering manager no longer just sees a status. They see:
- The Blocker: “Authentication bug in the payment API.”
- The Effort: “2 hours of focused work.”
- The Story: The developer was stuck, not slacking off.
This level of detail helps get problems solved faster. A team lead can immediately see the issue, grasp its complexity, and jump in with the right support, all without having to wait for the next daily standup. It creates a more proactive, supportive culture where data is used to help people, not to watch over their shoulder. This method directly links the daily grind in Zest to the project’s heartbeat in Linear or Jira, making sure no important context ever gets lost.
Building An Actionable Developer Productivity Dashboard
Looking at metrics from different tools in isolation gives you a fragmented, often misleading picture of what’s really happening. The magic happens when you bring data from Zest, Linear, and Jira together into a single, unified dashboard. This isn’t about tracking every number you can find; it’s about telling a clear story with your data.
A well-designed dashboard turns raw data into a narrative, connecting the day-to-day developer experience with your bigger project goals. When you blend project momentum with workflow efficiency, you can finally spot meaningful trends, prove the value of new tools, and have much more informed, supportive conversations with your team.
Designing Your Unified Dashboard Layout
Structure is everything. A random collection of charts just creates noise. Instead, organize your metrics into thematic sections that tell a story about different parts of your engineering process. This kind of layout gives you a balanced perspective, so you don’t get fixated on one thing, like raw output.
A practical way to structure your dashboard could look something like this:
- Project Momentum: This section is all about high-level delivery. Pull in Cycle Time from Jira or Linear to see how quickly work moves from “in progress” to “done.” Add Project Velocity to get a feel for your team’s overall throughput and predictability.
- Workflow Efficiency: This is where you get into the how of the work, using Zest’s unique data. Showcase AI Usage Patterns to see how well new tools are being adopted and track “Stuck Time” to pinpoint exactly where friction is slowing people down.
- Team Health & Collaboration: This is your qualitative check-in. Use insights from Zest’s AI Standups to surface common blockers or highlight big wins. It’s a great way to get a pulse on team morale and see where collaboration is breaking down.
This approach ensures you’re looking at both the forest (project delivery) and the trees (individual workflows), giving you a complete picture of team performance.
Connecting The Dots With Data Correlations
The most powerful insights come from seeing how metrics from different tools relate to each other. This is where you connect the ground-level data from Zest with the project-level outcomes in Linear or Jira. By watching these relationships, you can move from just observing what’s happening to truly understanding why.
Here are a few high-impact connections to track on your dashboard:
- “AI Time Saved” (Zest) vs. “Lead Time for Changes” (Jira/Linear): This is the ultimate proof of AI’s value. A clear trend showing that more time saved with AI correlates with faster delivery is a powerful way to justify investing in these tools and the training to use them well.
- “Stuck Time” (Zest) vs. “Ticket Reopens” (Jira): A spike in “Stuck Time” followed by a rise in reopened tickets is a huge red flag. It often means developers are struggling with task complexity or don’t have enough context, which leads to rework.
- “Prompt Success Rate” (Zest) vs. “Bugs per Feature” (Jira): If you see a low success rate on AI prompts, keep an eye on your bug count. It might correlate with an increase in minor bugs, suggesting that ineffective AI usage could be introducing subtle errors into the code.
By visualizing these correlations, you stop managing tickets and start managing the system of work. You can identify systemic issues and opportunities for improvement that would be completely invisible if you only looked at one tool’s data.
Sample Unified Productivity Dashboard
To give you a concrete example, here’s a sample layout for a unified dashboard. This structure is designed to provide a holistic view by pulling together the most important metrics from Zest, Linear, and Jira into one coherent story.
| Dashboard Section | Key Metrics | Source Tools |
|---|---|---|
| Project Momentum | Cycle Time, Lead Time for Changes, Project Velocity, Release Frequency | Linear, Jira |
| AI Impact & Adoption | AI Time Saved, AI Usage Patterns, Prompt Success Rate, Code Completions Accepted | Zest |
| Workflow Friction | “Stuck Time” Analysis, Pull Request (PR) Review Time, Time to Merge | Zest, Jira, GitHub |
| Code Quality & Rework | Ticket Reopen Rate, Bugs per Feature, Hotfix Frequency | Jira, Zest |
| Team Health (Qualitative) | Top Blockers, Celebrated Wins, Collaboration Patterns (from AI Standups) | Zest |
This dashboard moves beyond simple output tracking. It provides a balanced view that connects day-to-day coding activities with project delivery and team well-being, allowing for much more nuanced and effective management.
For an even deeper analysis, you can visualize data distributions using a box and whisker plot maker right in your dashboard. It’s a fantastic way to quickly spot outliers in metrics like cycle time or stuck time and understand the spread of your team’s performance.
Ultimately, this integrated approach gives engineering leaders a complete, data-driven narrative, helping them make smarter decisions and build healthier, more effective teams.
How to Make These Metrics Actually Useful for Your Team
Let’s be honest: data is useless if you don’t do anything with it. The whole point of tracking developer productivity metrics across Zest, Linear, and Jira isn’t just to make pretty dashboards. It’s about making real, tangible improvements for everyone on your team. That means turning high-level data into specific, supportive actions for developers and managers alike.
For this to work, you need a mental shift. These metrics should never, ever be a tool for micromanagement or surveillance. Think of them as a shared resource that helps developers own their growth and helps managers become better coaches. The right data builds a culture of continuous improvement, not one of fear.
Helping Developers Coach Themselves
Often, the best insights come when developers can see their own data. The personal insights in Zest give them a private, objective look at their habits. It turns that vague feeling of being “stuck” into concrete data points they can actually do something about.
This is where a feature like AI Hints acts like a personal coach. A developer might see Zest flagging a pattern of clunky, inefficient prompts. Seeing this, they can start refining their prompting skills on their own—maybe by adding more context or rephrasing their questions. This kind of self-directed improvement is far more powerful and lasting than any top-down feedback.
Give developers direct access to their own workflow analytics. It builds autonomy and mastery. They can spot their own bottlenecks—like constant context switching or getting tangled in one part of the codebase—and take steps to fix them.
Guiding Better Conversations with Data
For engineering managers, the combined data from a unified dashboard is a tool for support, not scrutiny. If you notice a trend, like the team’s “Stuck Time” is creeping up, the goal isn’t to ask, “Why are you all working slower?” It’s to ask, “I’m seeing some friction here. What can I do to help unblock everyone?”
This approach turns metrics into the starting point for a supportive conversation. Zest’s AI Standups are perfect for this. In your next team meeting, you could use the auto-generated summaries to:
- Celebrate wins: Give a shout-out to a developer who found a brilliant AI-assisted solution, and have them share it with the team.
- Solve blockers together: When a standup surfaces a common blocker, it’s not an individual failure. It’s a team problem to solve.
Managing this way builds trust and psychological safety. It makes it obvious that metrics are there to help the team win together. The modern engineering world is already moving past rigid DORA metrics anyway. As teams using Jira and Linear bring more AI into their work, frameworks like SPACE and DX Core 4 that focus on developer well-being become essential. You can find more on this shift in the 2025 State of the Developer Ecosystem report.
Ultimately, making developer productivity metrics from Zest, Linear, and Jira actionable is about creating a positive feedback loop. Developers use their personal data to improve their craft, managers use team-level data to provide better support, and everyone works together to build a healthier, more effective engineering culture.
Frequently Asked Questions
It’s easy to get lost in the world of developer productivity metrics, especially when you’re trying to connect insights from tools like Zest with your existing project management in Linear or Jira. Here are answers to some of the most common questions we hear.
Can Zest Replace Jira Or Linear For Project Management?
No, and it’s not designed to. Think of Zest as a specialized lens for your development workflow, while tools like Jira or Linear manage the project’s big picture.
Zest gives you deep, real-time insights into how your team uses AI to code—metrics that project management platforms just can’t see. The best approach is to combine them. You get the project-level data from Jira or Linear (the what) and the developer-centric workflow data from Zest (the how), creating a complete picture of your team’s productivity.
How Do You Prevent Developers From Gaming Zest Metrics?
We designed Zest to be incredibly difficult to game because it focuses on the process, not just the output. It avoids easily manipulated metrics like “lines of code.”
Instead, Zest measures things like prompt effectiveness, context switching, and ‘stuck time’. These metrics reflect genuine coding habits. Trying to game them would be more work than just doing the work well. Plus, features like AI Standups add crucial qualitative context, building a culture where the numbers support the real story, not replace it.
What Is The First Step To Integrating Zest With Our Jira Workflow?
Getting started is straightforward. The first step is simply having your developers install the Zest extension for their IDE, like VS Code. It starts collecting valuable workflow data right away with almost no configuration.
Once that’s done, managers can immediately begin connecting Zest’s insights to their Jira tickets. For example, when a developer flags a blocker in their AI Standup, you can link that directly to the relevant ticket. This gives you a much richer understanding of what’s really holding up progress.
Is Zest Only Useful For Teams Heavily Using AI Assistants?
While Zest’s AI-specific metrics are unique and powerful, its core value is in understanding the entire developer workflow. It tracks fundamental data points like focus time and sources of friction that matter for any development team, AI-assisted or not.
That said, the more your team adopts AI coding assistants, the more valuable Zest’s insights become. It’s the only way to truly see how these tools are impacting your team’s efficiency and where you can make improvements.
Putting It All Together: Mastering AI Productivity Metrics
So, how do you get a true picture of your team's performance? You can’t just rely on Jira tickets or Linear cycle times anymore. The real magic happens when you combine project management data with on-the-ground AI workflow insights from a tool like [Zest](https://zest.ai).Think of it this way: Jira and Linear tell you what got done. Zest tells you how it got done.
The Metrics That Actually Matter
Let’s cut through the noise. If you’re using AI in your coding workflow, these are the three metrics you need to be tracking:
- AI Time Saved: This isn’t just a vanity metric. It’s a concrete number that shows the efficiency boost your team gets from AI assistants in editors like VS Code or Cursor.
- Workflow Friction Score: We’ve all been there—stuck, spinning our wheels. This score pinpoints that “stuck time,” highlighting moments of struggle or ineffective AI prompts that are killing momentum.
- Integrated Cycle Time: This is where it all comes together. By linking Linear or Jira ticket data with Zest’s coding activity, you can finally see the real reason a ticket is taking longer than expected. It connects the high-level project view with the low-level reality of development.
My Personal Playbook for Success
Over the years, I’ve developed a few simple rules for getting this right. I call them my cheat codes.
- Context Over Command: A Jira ticket tells you what a developer is working on. Zest’s AI Standups tell you why they might be struggling or what creative solutions they’re finding. Use Zest to add the story behind the status update.
- Correlate, Don’t Replace: Don’t throw out your Linear metrics! Instead, layer Zest’s AI workflow data on top. This gives you a complete, multi-dimensional view of productivity that one tool alone could never provide.
- Empower, Don’t Enforce: The goal here is to coach, not to micromanage. Use the data from Zest to help developers learn how to use AI more effectively, not to hit some arbitrary quota. It’s about making everyone better.
A Few Questions to Ask Yourself
As you start integrating these insights, take a step back and reflect.
- Are our current Jira metrics telling the whole story of developer effort? Or are they just tracking movement without measuring progress?
- Could hidden workflow friction explain why some Linear cycles are longer than others? Maybe that “slow” developer is actually hitting complex roadblocks no one else sees.
- How can we use Zest’s insights to create and share best practices for AI use across the team? If one developer finds a great prompting technique, how do you make sure everyone benefits?
Unified Dev Metrics Playbook
Create a positive feedback loop by connecting project outcomes in Jira/Linear with real-time workflow intelligence from Zest.
📊 Core Metrics
- AI Time Saved — tangible efficiency gains from AI coding assistants
- Workflow Friction Score — measures "stuck time" and ineffective AI prompt patterns
- Integrated Cycle Time — combines Jira/Linear tickets with Zest coding activity for full context
🕹️ My Cheatcodes
- 🌱 Context Over Command — use Zest's AI Standups to add the story behind a ticket status
- 🦎 Correlate, Don't Replace — layer Zest's workflow data on top of Linear's momentum metrics
- ⚡ Empower, Don't Enforce — use data for coaching AI skills, not enforcing quotas
📈 Reflection Points
- 💡 Do our Jira metrics tell the whole story of developer effort?
- 🧩 Could hidden workflow friction explain long Linear cycles?
- 📘 How can we use Zest insights to share AI best practices team-wide?
Gallery
Lemon shots