
A Practical Guide to Developer Productivity Metrics

For a long time, the idea of measuring developer productivity felt like trying to bottle lightning. How do you quantify creativity and problem-solving? The old way was to count things—lines of code, hours logged, tickets closed. But that’s like judging a chef by how many pots they used, not by how the food tastes.
These days, smart engineering leaders know better. True developer productivity isn’t about busywork. It’s about measuring the health, speed, and effectiveness of the entire software delivery system. It’s about understanding the flow of work from an idea all the way to a happy customer, identifying the real bottlenecks, and empowering teams to make meaningful improvements.
Moving Beyond Lines of Code

Let’s be blunt: measuring individual output with metrics like “lines of code” is not only outdated, it’s often harmful. It treats engineering like an assembly line and completely misses the point of what makes a developer great.
Think about it. A developer who removes 500 lines of bloated, redundant code to make the system faster is far more productive than someone who adds 1,000 new lines that introduce complexity. The goal isn’t just to build more stuff; it’s to build the right stuff, well. We need a holistic view that captures the entire development lifecycle, from initial concept to deployment and real-world performance.
A Modern Framework for Performance
The right developer productivity metrics shift the conversation from activity to outcomes. Instead of asking, “How much did we do?” we start asking, “What value did we deliver, and how smoothly did we deliver it?”
This modern approach is built on a few core ideas:
- Focus on System Health: Don’t just look at individual developers. Measure the entire process—from the time it takes to review code to how smoothly your deployment pipeline runs.
- Prioritize Stability: A productive team ships software that works. Metrics must account for quality. Speed is meaningless if every release is followed by a fire drill to fix bugs.
- Value Continuous Flow: High-performing teams deliver small, incremental changes quickly and safely. This rhythm reduces risk, shortens feedback loops, and keeps momentum high.
- Connect to Business Goals: The best metrics tie directly to what the business cares about, like customer happiness or how many people are using a new feature.
This focus on the bigger picture is where things get interesting. For example, implementing practices like DevOps automation is a great way to streamline the system and improve the flow of value.
The Shift in Measuring Developer Productivity
The table below shows just how much our thinking has evolved. We’ve moved from tracking busywork to measuring real impact.
| Metric Focus | Outdated Metric (Avoid) | Modern Metric (Embrace) |
|---|---|---|
| Work Volume | Lines of code, number of commits | Cycle time, deployment frequency |
| Individual Activity | Hours logged, “story points” per person | Team velocity, work-in-progress limits |
| Quality | Bug count (in isolation) | Change failure rate, mean time to restore |
| Team Well-being | None (often ignored) | Developer satisfaction surveys, burnout risk |
By embracing this modern approach, you’re not just getting better data; you’re building a healthier, more effective engineering culture. When teams are measured on outcomes they can actually influence, they become more engaged and empowered.
The proof is in the results. A McKinsey study found that teams focusing on the right metrics see 20–30% fewer customer-reported bugs and a major bump in customer satisfaction. By adopting these modern principles, you can create a data-driven environment that truly fosters collaboration and continuous improvement.
If you want to dig deeper into the philosophy behind this, check out our complete guide on what is software productivity for more insights. It’s all about moving from gut feelings to genuine, measurable success.
The Four Metrics That Matter for High-Performing Teams
Before we dive into the weeds of measuring productivity, we need to get on the same page. Thankfully, the industry has largely settled on a fantastic framework developed by the DevOps Research and Assessment (DORA) team. These four metrics give us a balanced way to look at how a software team is doing by measuring both its speed and its stability.
Think of your engineering team like a high-end kitchen. You want to get delicious food (new features) out to your customers quickly, but you also can’t afford to send out a dish that’s wrong or makes someone sick. The DORA metrics are like checking the kitchen’s pulse—they tell you how fast the chefs are working and how often they’re getting the orders right. It shifts the focus from judging individual cooks to understanding the health of the entire kitchen operation.
Deployment Frequency
This is the most straightforward of the four metrics. Deployment Frequency simply answers the question: How often do we successfully get our code out to users?
This isn’t about pushing code just for the sake of it. The best teams deploy small, incremental changes all the time—often daily, or even multiple times a day. It’s the difference between sending out a continuous stream of small, fast delivery drones versus one massive, slow-moving cargo ship every few months.
- Less Risk: When you deploy tiny changes, it’s much easier to spot and fix something if it goes wrong. The blast radius is tiny.
- Quicker Feedback: Getting features into users’ hands faster means you learn what works and what doesn’t much sooner.
- Builds Momentum: A steady rhythm of successful deployments creates a powerful sense of progress and keeps the team’s energy high.
Elite teams deploy on-demand, whenever they need to. In contrast, low-performing teams might struggle to get a release out the door less than once a month. This metric is a dead giveaway for how agile your team really is and how smooth your deployment pipeline runs.
Lead Time for Changes
While Deployment Frequency tracks how often you ship, Lead Time for Changes measures how fast you can get an idea into production. It specifically tracks the time from the moment a developer commits a line of code to the moment that same code is live and running for users.
This metric cuts through the noise and shows you the actual speed of your entire delivery process, from code review and testing all the way through the final deployment.
A long lead time is like being stuck in a traffic jam on the highway to production. It doesn’t matter how fast your developers can code if they’re constantly hitting bottlenecks like manual testing queues, slow code reviews, or bureaucratic approval gates.
Top-tier teams have a lead time of less than one hour. A short lead time is a massive competitive advantage, allowing you to respond to customer needs, patch critical security issues, and deliver value at a pace your competitors can’t match.
Change Failure Rate
Speed means nothing if what you’re shipping is broken. Change Failure Rate is the crucial balancing metric that keeps an eye on quality. It answers a simple but vital question: Of all our deployments, what percentage cause a problem in production?
A “failure” could be anything from a bug that messes up the user experience to a full-blown service outage that requires an emergency fix, like a hotfix or a rollback. This number is a direct reflection of how solid your quality checks are—your automated tests, your code review culture, all of it.
A low Change Failure Rate is a sign of a team that builds quality in from the very beginning, not one that tries to tack it on at the end. Teams with high failure rates are constantly fighting fires, spending their time fixing what’s broken instead of building what’s next. Elite teams keep their Change Failure Rate between 0-15%, proving that you really can move fast without breaking things.
Time to Restore Service
Look, no system is foolproof. Failures are going to happen. The real question is, how quickly can you bounce back? Time to Restore Service (also known as Mean Time to Recovery or MTTR) measures exactly that. When something goes wrong in production, how long does it take to fix it and get things back to normal for your users?
This is the ultimate test of your team’s resilience and incident response muscle. A short recovery time shows you have great monitoring and alerting, clear on-call playbooks, and the ability to diagnose and ship a fix in a hurry.
For the best teams, this recovery time is less than one hour. Being able to recover that quickly builds incredible trust with your customers and minimizes the business impact of any outage. It proves your systems aren’t just built to run—they’re built to be repaired, fast. Together, these four metrics give you a powerful and holistic dashboard for your engineering team’s health.
How AI Is Rewriting the Rules of Productivity
The old image of a productive developer—hunched over a keyboard, banging out code for hours—is officially a thing of the past. AI coding assistants have completely changed the game, acting as a powerful new partner for engineering teams everywhere.
These aren’t just glorified autocomplete tools; they’re genuine collaborators. They take on the tedious, soul-crushing tasks that used to eat up a developer’s day, like writing boilerplate code, spinning up unit tests, or even drafting documentation. This frees up developers to focus on what really matters: high-level system design, architectural decisions, and the tricky business of reviewing complex code.
This change means we have to rethink what developer productivity metrics actually measure. It’s not just about how fast someone can type anymore. It’s about the quality of their thinking and how effectively they work with their AI assistant.
The New Productivity Equation
The most obvious benefit of AI is speed. Developers can get functional code up and running faster than ever. But that speed comes with a new set of trade-offs that our measurement strategies need to account for.
An AI might spit out a function in seconds, but a human still has to carefully check its work. Is the code secure? Will it scale? Does it properly handle all the weird edge cases? The time spent validating and debugging AI-generated code can easily cancel out the initial time saved.
AI fundamentally changes the developer’s role from a primary creator of code to a curator and critic of AI-generated suggestions. Productivity is now less about typing speed and more about the speed of sound judgment.
Our metrics have to keep up. A simple metric like “pull request velocity” might go up, but we also need to ask if that’s causing a spike in the change failure rate or more time spent hunting down bugs after deployment. The best teams are the ones who figure out how to balance the incredible speed of AI with the irreplaceable wisdom of human experience.
Adapting Metrics for an AI-Augmented World
To get a true picture of productivity today, we need to look beyond the classic DORA metrics. They’re still incredibly important, but they don’t tell the whole story of an AI-assisted workflow.
The DORA metrics, shown below, give you that crucial baseline for understanding your system’s health and stability, even as AI changes how the work gets done.
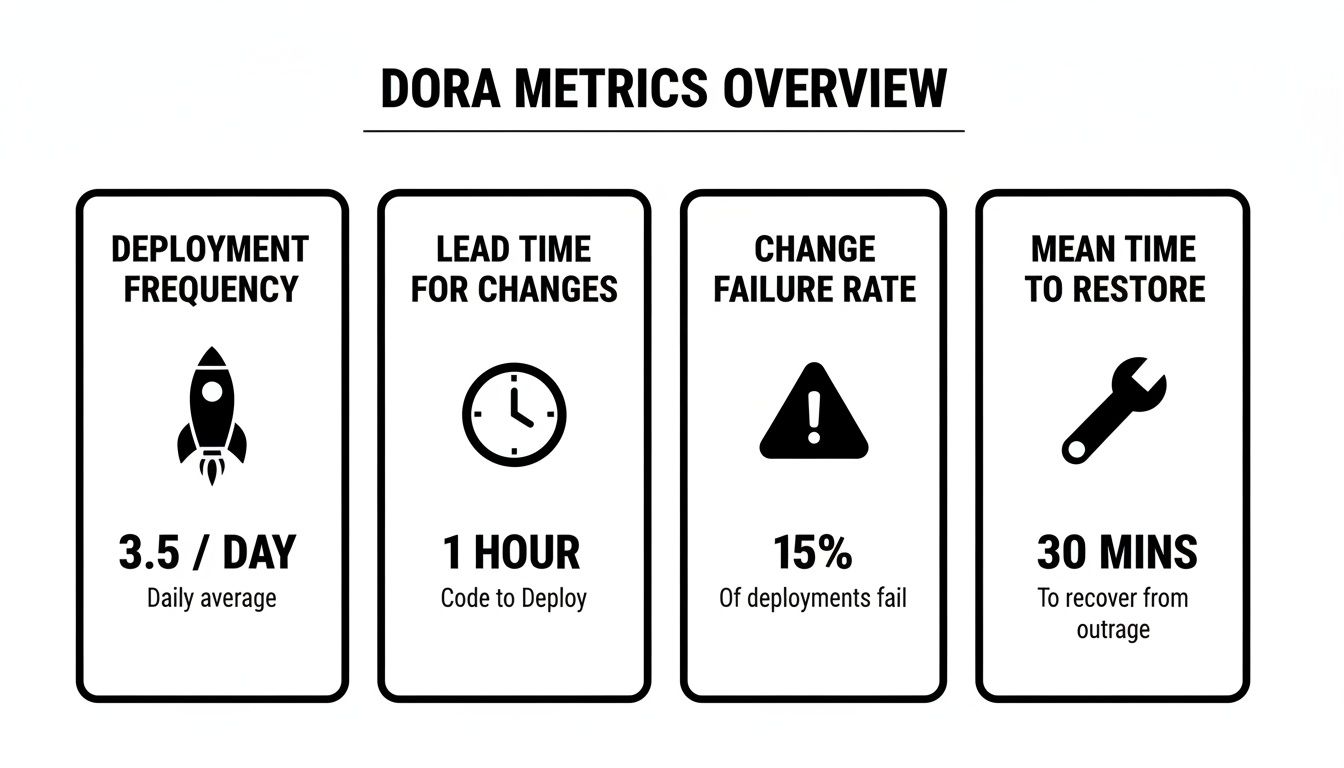
These four pillars—Deployment Frequency, Lead Time, Change Failure Rate, and Time to Restore—are still the bedrock of measuring your delivery pipeline’s performance. The big question now is how AI tools are influencing each one.
The adoption of AI in developer workflows has been nothing short of explosive. In 2025, AI adoption among software developers hit a staggering 90%, jumping 14% from the year before. Research from Fullview.io shows that AI tools can boost coding speed by up to 55% and increase pull request velocity by 26%. This efficiency translates to a 15% higher merge rate for pull requests, which points to better code quality right out of the gate. With nearly 70% of developers reporting they spend less mental energy on repetitive tasks, the shift is clear: we need metrics that reflect this new reality of AI-enhanced quality and efficiency.
This isn’t just a small adjustment; it’s a whole new way of thinking. For a deeper look at how to optimize your team’s workflow in this new landscape, check out our guide on productivity for developers. At the end of the day, winning with AI isn’t about just buying a new tool. It’s about adapting your culture, your processes, and your measurement strategy to build software in a fundamentally different way.
The Hidden Costs of AI-Assisted Development
AI tools promise to supercharge engineering teams, but the reality on the ground is often a lot messier. That initial burst of speed from generating code in seconds feels amazing, but it can also create a false sense of progress. If you’re leading a team, you have to look past the hype to see what’s really going on.
One of the biggest hurdles is the gap between how productive developers feel and what the data actually shows. It’s a strange phenomenon—engineers often report feeling more productive even when some tasks are taking longer. This isn’t just wishful thinking. AI often takes care of the boring, repetitive parts of coding, freeing developers to tackle more interesting challenges. That creates a feeling of flow and speed, even if the total time spent—including all the checking and fixing—goes up.
This new dynamic adds a tricky new layer to how we measure developer productivity metrics.
Quantifying the AI Tax
The biggest hidden cost by far is the time teams now have to spend checking and debugging AI-generated code. This “AI tax” can silently eat away at any time saved during the initial code generation. Sure, an AI might spit out a function in five seconds, but if a developer spends the next hour trying to fix its subtle bugs, you haven’t actually gained anything.
And that validation work is absolutely essential. AI models are impressive, but they don’t truly understand context. They can easily introduce security holes, performance bottlenecks, or just plain incorrect logic that a human has to catch. The real kicker is that reviewing someone else’s (or something else’s) code is often much harder and more draining than just writing it yourself from the start.
It’s like being handed a complex machine with no instruction manual. You might have saved time on assembly, but you’re now spending double the effort figuring out if it was built correctly in the first place.
This is exactly where our traditional developer productivity metrics have to adapt. We need to start accounting for this new, intense kind of mental work.
The Debugging Dilemma
The struggle with debugging AI code is a known bottleneck. In field experiments with nearly 5,000 developers, AI tools did increase overall productivity by an average of 26.08%, but a big chunk of that gain was lost to quality assurance problems. In fact, 45% of developers said that debugging AI-generated code took them longer than fixing human-written code. As you can discover more insights about these AI developer community statistics, it’s clear that you can’t just focus on speed; you have to balance it with careful verification.
This debugging overhead is something every engineering leader needs to be tracking. If you ignore it, you’re getting a wildly optimistic and incomplete picture of AI’s real impact. If you want to dive deeper into this, we’ve outlined some practical steps for improving your approach to AI code debugging.
To get a true sense of things, leaders need to start asking some different questions:
- How much time is my team really spending validating AI suggestions for each new feature?
- Is our Change Failure Rate creeping up because of subtle bugs introduced by AI?
- Are my developers leaning too heavily on AI and letting their own problem-solving skills get rusty?
Answering these requires a more thoughtful approach. It means you have to go beyond simple output metrics and build a system that shows you both the good and the bad of how AI is shaping your development process. Without that balanced view, you risk chasing a productivity mirage while quietly racking up a mountain of hidden technical debt.
Building a Healthy Metrics Program

Moving from theory to practice is where the rubber meets the road. Rolling out a developer productivity metrics program is about much more than just picking KPIs. It’s about people. It demands a thoughtful, human-first approach that builds trust and actually empowers your team.
The whole point is to create a system that feels like a helpful diagnostic tool, not a surveillance camera. If developers feel like they’re being watched, they will find creative ways to game the numbers. When that happens, you lose their trust and any shot at getting real, meaningful insights.
Gaining Team Buy-In
This is the most critical piece of the puzzle: involve your team from day one. Don’t just hand down a list of metrics from on high. Instead, open up a conversation about what’s frustrating them in their current workflow.
Frame the whole thing as a team effort to fix the system, not to judge individuals. Make it clear that the goal is to use data to find bottlenecks—like sluggish code reviews or a clunky deployment process—that everyone can work together to solve. This turns metrics from a weapon into a shared language for improvement.
The cardinal rule of a healthy metrics program: Never, ever use developer productivity metrics in individual performance reviews. The moment you do, the data becomes weaponized, and the entire system breaks down.
To make this work, you have to cultivate an environment of psychological safety. People need to feel comfortable talking about what the data shows—the good and the bad—without anyone pointing fingers. This turns metrics into the start of a productive conversation, not the final word on performance.
Start Small and Show Value
Don’t boil the ocean. You don’t need to measure everything all at once. Kick things off with a small, manageable set of metrics that give you a clear signal on your system’s health. The DORA metrics are a fantastic place to start because they provide a nice, balanced view of both speed and stability.
Here’s a simple, three-step plan to get rolling:
- Automate Data Collection: Manually pulling data is a non-starter. Use tools to automatically grab metrics from the systems you already use, like Git and your CI/CD pipeline.
- Visualize the Trends: Set up a simple, shared dashboard where the entire team can see the metrics. The key is to focus on trends over time, not static numbers.
- Hold Regular Check-Ins: Use your team’s regular retrospectives to look at the data together. Ask open-ended questions like, “What do you think this trend is telling us?” or “What’s one small experiment we could try to improve our lead time?”
This iterative approach shows value right away and builds momentum. Once the team sees how the data helps them solve real-world problems, they’ll become champions of the program.
Avoiding Common Pitfalls
Even with the best intentions, it’s easy to stumble. One of the most common traps is creating what we call “perverse incentives.” For example, if you focus too much on a single metric like Deployment Frequency, you might find teams pushing tiny, meaningless changes just to pump up their numbers.
This is exactly why you need a balanced set of metrics. It’s also why context is king. Data without a story is just noise. Always pair your numbers with qualitative feedback from your team to get the “why” behind the what.
A fascinating modern pitfall is the gap between perception and reality, especially with AI tools. You’d think AI would make everyone faster, right? Well, a recent randomized trial found that experienced open-source developers using AI tools actually took 19% longer to complete tasks. Despite this, the developers felt they were 20% faster. This highlights a massive disconnect. As you can learn more about these findings on AI productivity, it’s a stark reminder that we need objective data to balance our subjective feelings.
Ultimately, a healthy metrics program is a tool for learning. It should spark curiosity and give your team the insights they need to become masters of their own process. For more on this, check out the great articles and best practices on Taskignite’s blog.
Here’s a look at the bigger picture. When you get right down to it, the best developer productivity programs are all about one thing: system-level outcomes. We’re not trying to measure how busy people look; we’re trying to measure the impact they have. The goal is to see the entire software delivery lifecycle for what it is—a system—and understand how efficiently an idea travels all the way to a customer.
This data should never, ever be a report card. It’s not for judging individuals. Think of it as a compass that points your team toward the right conversations. If you notice your Lead Time for Changes is creeping up, that’s not a sign to blame developers. It’s a signal to get curious and ask, “What’s getting in our way? What’s slowing the whole system down?” This changes the dynamic completely, creating a culture where everyone feels ownership over the process and works together to make it better.
Your North Star in Modern Engineering
The real magic of frameworks like DORA is how they create balance. They force you to look at speed and stability at the same time, which stops you from optimizing for one while sacrificing the other. These metrics give everyone—from developers to VPs—a shared language to talk about bottlenecks, celebrate improvements, and figure out where to focus next.
The whole point of measuring developer productivity is to improve the system so developers can do their best work. It’s about removing friction, not adding pressure.
This becomes even more critical as AI changes how we build software. The job is shifting. It’s less about typing out every line of code and more about a delicate dance of generating, reviewing, and thinking critically about the output. The day-to-day tasks might change, but the core principles of measuring flow, quality, and stability are more important than ever. They are your north star.
By sticking to these fundamentals, you build an engineering culture that’s resilient and high-performing. When you treat data as a tool for learning and empowerment, you create an environment where getting better every day isn’t just a poster on the wall—it’s what you actually do. That’s how you drive real, lasting results.
Frequently Asked Questions
Even with a solid framework, putting developer productivity metrics into practice is bound to bring up some real-world questions. Here are some straightforward answers to the common challenges engineering leaders run into.
How Do I Start Measuring Without Overwhelming My Team?
The trick is to start small and make it a team effort. Don’t try to roll out a dozen new metrics overnight. That’s a recipe for confusion and burnout.
Instead, pick just one or two foundational DORA metrics, like Deployment Frequency and Lead Time for Changes. Automate the data collection from the tools you already use, like Git and your CI/CD pipeline.
Most importantly, when you show this data to your team, frame it as a tool for them, not a report card for management. Position it as a collective experiment to help everyone see how the system is working and find ways to improve it together.
What Are the Biggest Mistakes to Avoid With Metrics?
The absolute number one mistake is tying developer productivity metrics to individual performance reviews. The second you do that, you’ve lost. You’ll create fear, incentivize people to game the numbers, and destroy any trust you had. The data becomes totally useless overnight.
A few other major pitfalls to steer clear of:
- Comparing teams without context. Every team has its own unique projects, constraints, and legacy code. Direct comparisons are almost never fair or helpful.
- Focusing on activity, not outcomes. Steer clear of vanity metrics like lines of code or number of commits. Stick to things that actually reflect the health and stability of your delivery system.
- Ignoring the human story. The numbers tell you what is happening, but you have to talk to your team to understand why.
Our Team Metrics Are Not “Elite.” What Should We Do?
First off, don’t panic. The goal isn’t to magically hit some arbitrary “elite” status on day one. It’s about establishing a baseline so you can see your own progress over time. The metrics are a starting point, not a final grade.
Use the data to start a conversation. Bring the numbers to your next team retrospective and ask some open-ended questions:
- “Looking at this, what bottlenecks are we all feeling?”
- “What’s the most frustrating part of our current process?”
- “What’s one small experiment we could try next sprint to see if we can move this number?”
Think of the data as a diagnostic tool. Its real value is in helping you and your team spot and solve the systemic problems that get in everyone’s way.
Master Developer Productivity Metrics
Use data as a tool for learning and empowerment to build a resilient, high-performing engineering culture.
📊 Core Metrics
- Deployment Frequency — How often code is successfully released to users.
- Lead Time for Changes — The time from code commit to code in production.
- Change Failure Rate — Percentage of deployments causing a production failure.
🕹️ My Cheatcodes
- 🌱 System Over Individual — Focus on improving the process, not judging the people.
- 🦎 Outcomes Over Activity — Measure the value delivered, not the volume of work done.
- ⚡ Data as a Compass — Use metrics to start conversations and identify system bottlenecks.
📈 Reflection Points
- 💡 Are we using our data to learn or to blame?
- 🧩 Do our metrics account for the hidden "AI tax" of debugging and validation?
- 📘 Does our team feel psychologically safe to discuss what the metrics reveal?
Gallery
Lemon shots



