
Definition of Cycle Time: definition of cycle time and how to improve delivery

In software development, cycle time is the total time it takes from the moment work actively begins on a task until that task is finished. Think of it as hitting the stopwatch the second a developer pulls a ticket and stopping it only when their code is merged and ready to ship.
What Is Cycle Time in Software Development
Let’s use a restaurant kitchen analogy. Cycle time isn’t the entire experience from a customer ordering to getting their food. Instead, it’s the specific time from when the chef starts cooking the meal to when the dish is fully plated and sitting on the pass, ready for a server to pick it up.
This is exactly how cycle time works in software. It measures the efficiency of your team’s “kitchen,” focusing squarely on the active development stages. It has become one of the most important metrics for understanding how quickly your team can turn ideas into working code.
A low cycle time is a strong sign of a high-performing team. It means work is flowing smoothly through your development pipeline without getting stuck. For engineering leaders, tracking and improving this metric is fundamental to delivering value faster.
The Stages of the Cycle Time Clock
Cycle time isn’t just one big chunk of time. It’s actually the sum of several distinct phases where work is either being actively done or is waiting for the next step. To really get a handle on it, you need to break it down. Modern development practices, like those outlined in a good DevOps for startups playbook, often bake in principles that naturally help reduce cycle time by focusing on speed and stability from day one.
Let’s look at the typical stages that make up the total cycle time.
Key Stages of the Cycle Time Clock
| Stage | Starts When | Ends When | Key Activities |
|---|---|---|---|
| Active Development | Task is moved to “In Progress” | Pull request (PR) is created | Coding, debugging, writing unit tests |
| Code Review | Pull request is created | Pull request is approved | Waiting for review, responding to comments |
| Merge & Testing | Pull request is approved | Code is merged into main branch | Running automated tests (CI), resolving conflicts |
By understanding what happens in each of these stages, you can pinpoint exactly where things are slowing down.
Key Takeaway: Cycle time gives you a clear, unfiltered look at your team’s execution speed. It isolates the active development process from upstream planning and downstream deployment, giving you a precise metric for finding and fixing friction in your workflow.
Understanding Cycle Time vs Lead Time vs Throughput
In the world of software development, we toss around a lot of metrics to track how we’re doing. But three of the most important ones—cycle time, lead time, and throughput—often get jumbled together. They all measure parts of your workflow, but they tell completely different stories.
Getting the distinction right is the key to knowing where your process is actually broken and where it’s humming along.
Let’s use an analogy: ordering a package from an online store. Each metric offers a unique window into that delivery process.
Lead Time: The Customer’s Perspective
Lead time is the total time your customer waits. Period. It starts the second a request is made (like clicking “Buy Now” or a ticket being created) and doesn’t end until the value is in their hands (the package arrives or the feature is live in production).
This metric captures everything—the time a ticket sits in the backlog gathering dust, planning meetings, active coding, reviews, and deployment. If an idea waits for three weeks before a developer even lays eyes on it, all that time counts toward its lead time. For a deeper dive, check out our guide on what lead time means in software development.
Cycle Time: The Factory’s Perspective
Cycle time, as we’ve covered, is all about the “factory floor.” The clock starts ticking only when a developer picks up a task and begins active work—the “In Progress” stage. It stops when the code is merged and ready to ship, just like a package being boxed up and sitting on the loading dock.
Cycle time zooms in exclusively on the active development process.
This visual gives you a great breakdown of the typical stages that make up your team’s cycle time.
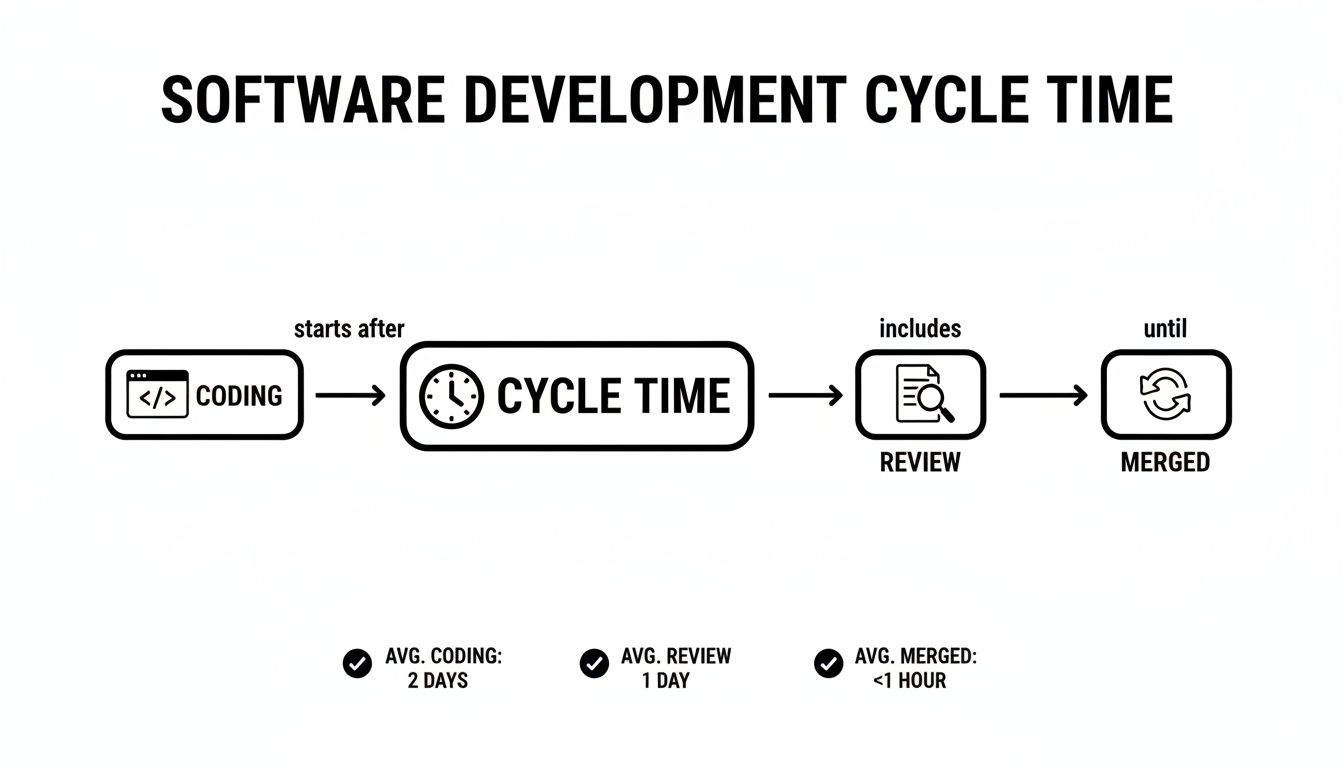
As you can see, it’s the sum of the hands-on stages, making it perfect for spotting bottlenecks within your team’s immediate workflow.
Throughput: The Factory’s Output
Finally, there’s throughput. This one is simple: it measures how much work your team gets done. It answers the question, “How many packages did we ship this week?”
In software, throughput is the number of tickets, stories, or tasks your team completes over a set period, like a sprint or a quarter. It’s a pure measure of team capacity and output volume.
A team might have a fantastic, low cycle time for individual tasks but still have low throughput if they just aren’t finishing many of them. On the flip side, high throughput with long cycle times could mean the team is shipping a lot, but each piece of work is a real slog to get through.
To make these differences stick, here’s a quick side-by-side comparison.
Cycle Time vs Lead Time vs Throughput at a Glance
This table lays out the core differences between these three critical metrics, helping you see exactly what each one is designed to measure.
| Metric | Measures | Starts | Ends | Answers the Question |
|---|---|---|---|---|
| Cycle Time | Team’s internal process speed | When active work begins | When work is ready to ship (merged) | How long does it take us to build something? |
| Lead Time | Total customer wait time | When a request is made (ticket created) | When the feature is delivered (in production) | How long did the customer have to wait? |
| Throughput | Team’s completion rate | Start of a time period (e.g., a week) | End of a time period | How much work can we finish in a week? |
Nailing down the distinction between these metrics is your first step toward building a more predictable and efficient engineering process. Each one gives you a different lens to view performance, helping you focus your energy where it will actually make a difference.
Why Tracking Cycle Time Matters for Your Team
So, you know what cycle time is. That’s the easy part. The real question is, why should you even care? It’s more than just another number on a dashboard; it’s a direct measure of your team’s ability to ship valuable work efficiently and predictably.
When you start tracking cycle time, you’re not just measuring speed. You’re getting a clear look under the hood of your entire development process. It’s the best tool I know for finding friction, cutting out waste, and ultimately, building a more effective engineering culture. A low and stable cycle time creates a positive feedback loop that helps everyone, from developers to the C-suite.
A Litmus Test for Team Health
Think of cycle time as a vital sign for your development workflow. A consistently low and predictable number tells you that work is flowing smoothly from “in progress” to “done.” It’s a sign of a healthy system.
On the other hand, a high or unpredictable cycle time is a major red flag. It points to underlying problems—things like fuzzy requirements, too much work in progress (WIP), or tickets getting stuck for days in code review. By focusing on this one metric, you can pinpoint exactly where those delays are happening. It changes the conversation from a blame-filled “Why is this taking so long?” to a productive “How can we make our code review process faster?”
Boost Morale and Cut Down on Frustration
Nothing kills a developer’s motivation faster than being blocked. Waiting around for feedback, approvals, or a deployment slot is incredibly frustrating and a fast track to burnout. A high cycle time often means developers are spending more time switching between tasks than actually building great software.
When you actively work to lower cycle time, you’re directly improving the developer experience. You get rid of those “hurry up and wait” moments, letting engineers stay in the zone, build momentum, and feel a real sense of accomplishment as their work moves quickly into the hands of users.
The Connection to DORA Metrics
If you need more proof of its importance, just look at the DORA metrics. These four metrics are widely seen as the gold standard for measuring the performance of elite engineering teams, based on years of rigorous research by the DevOps Research and Assessment (DORA) team.
The four DORA metrics are:
- Deployment Frequency (How often you release to production)
- Lead Time for Changes (How long it takes to get a commit to production)
- Change Failure Rate (The percentage of deployments causing a failure)
- Time to Restore Service (How long it takes to recover from a failure)
While DORA specifically tracks Lead Time for Changes, cycle time is a huge piece of that puzzle. Shrinking your internal cycle time is one of the most effective ways to shorten your overall lead time. It’s proof that your team isn’t just fast but is also aligned with the practices that define high-performing organizations.
How to Measure and Visualize Cycle Time
You don’t need a complicated setup to start measuring cycle time. At its heart, the calculation is simple: you just track the time from when real work starts on a task to when it’s officially “done.” That gives you a number, but the real magic happens when you start visualizing this data over time.

The basic formula is as straightforward as it gets:
Cycle Time = Completion Date - Start Date
The “Start Date” is the moment a task moves into an active column like “In Progress,” and the “Completion Date” is when the code is merged or ready to ship. Most project management tools, like Jira or Linear, capture these timestamps automatically as you move tickets across the board. Getting a handle on these foundational cycle time calculations is your first step toward making meaningful process improvements.
From Raw Data to Actionable Insights
Manually crunching these numbers for every single task is not only a massive time sink, but it also makes it nearly impossible to see the bigger picture. This is where visualization tools come in—they’re essential for spotting trends, identifying outliers, and shining a light on hidden bottlenecks. Two of the most effective charts for this are Control Charts and Cumulative Flow Diagrams.
- Control Charts: Think of these as a health monitor for your process. They plot the cycle time for each task over a period, helping you see how predictable your team is. If most of the dots are clustered around the average, you’re in good shape. If they’re all over the map? That’s a clear sign of inconsistency.
- Cumulative Flow Diagrams (CFDs): A CFD gives you a bird’s-eye view of your entire workflow, showing how much work is in each stage over time. If you see the band for a specific stage—say, “Code Review”—getting wider and wider, you’ve just found your bottleneck.
Automating Measurement for Real-Time Visibility
Modern engineering analytics tools take this a giant leap further. They automate the entire data capture process by plugging directly into your team’s development workflow. Instead of just looking at when a ticket status changes, these platforms analyze commits, pull requests, and other dev signals to paint a much more accurate, real-time picture of cycle time.
This hands-off approach eliminates the grunt work of manual tracking. It gives engineering managers immediate visibility into how things are really going, so they can tackle friction points before they derail a sprint. It completely shifts the focus from gathering data to actually acting on it.
By pairing a simple formula with powerful visualization and automation, you can turn cycle time from a static number into a dynamic tool for driving real, continuous improvement.
Uncovering the Bottlenecks That Inflate Cycle Time
If you want to shorten your cycle time, the first step is figuring out what’s stretching it out in the first place. Think of bottlenecks as friction points in your workflow—places where work slows to a crawl or stops completely. It’s time spent waiting, not creating.
Pinpointing these blockers is the single most important thing you can do to build a faster, more predictable development process. You’ll often find the biggest delays aren’t slow coding, but process issues that leave developers stuck in neutral.
Process Blockers and Wait States
The usual suspects behind long cycle times are the “in-between” stages where work just sits. These periods of inactivity can easily last longer than the actual coding time.
Here are a few common process blockers:
- Long Code Review Queues: A pull request sitting for days is a classic bottleneck. It doesn’t just delay the feature; it forces the developer to switch context, making it much harder to jump back in later.
- Vague Requirements: When a ticket is fuzzy on the details, developers have to stop what they’re doing and hunt down answers. All that back-and-forth adds a ton of overhead and often leads to rework.
- Cross-Team Dependencies: Ever had work that was “done” but couldn’t move forward? Waiting on another team—be it platform, security, or design—can bring a ticket to a dead stop.
These wait states are pure waste. They add days to your cycle time without adding an ounce of value. For a deeper dive into measuring these delays, you can explore different ways of calculating cycle time.
The High Cost of Context Switching
Beyond process gaps, forcing developers to constantly jump between tasks is a huge source of inefficiency. Every time a developer gets pulled from one thing to another, they lose focus and momentum. That “cognitive reload” time is like a hidden tax on their productivity.
The data backs this up. A 2022 survey revealed that 38% of developers spend a good chunk of their day just waiting on other people. Another 42% are stuck waiting on machines, like painfully slow build servers.
The same study found that 37% of developers struggled with finding documentation, 34% wrestled with merge conflicts, and 41% ran into flaky tests. All of these obstacles directly blow out the cycle time for any given task. Learn more about these developer productivity statistics.
Technical Debt and Merge Conflicts
Finally, let’s talk about technical debt. It acts like a constant anchor, dragging down your team’s speed. A messy or poorly documented codebase makes every new feature more difficult and time-consuming to build. What should be a simple change can turn into a major refactoring project, bloating the time spent on active coding.
Similarly, frequent and painful merge conflicts are a red flag. They’re often a symptom of something bigger—either work isn’t being broken down into small, manageable chunks, or team communication is off. This forces developers to spend valuable time untangling code instead of shipping it. By identifying these specific pain points, you can start making targeted improvements that actually work.
Proven Strategies to Reduce Your Cycle Time
Knowing your cycle time and finding the bottlenecks is half the battle. Now for the other half: taking action. Cutting down your cycle time isn’t about pressuring developers to code faster. It’s about clearing the roadblocks and paving a smoother path for their work to flow.
The strategies below are practical, high-impact changes you can make right away to fix common friction points. Think of them as ways to create a more direct route from “In Progress” to “Done.”
Break Large Epics into Small Stories
One of the best ways to speed up your workflow is simply to shrink the work. Huge, complex features are naturally slow and risky. They drag their feet through every single stage, from coding and review all the way to testing.
By breaking those big epics down into small, well-defined user stories—things that can be knocked out in a day or two—you create a fast-moving current of progress.
Key Insight: Smaller tasks just move faster. They’re easier to review, less likely to hide major bugs, and they let you integrate code more often, which seriously cuts down on the pain of merge conflicts.
This approach builds a steady rhythm of delivery. It provides constant momentum and the quick feedback loops that keep a team fired up and productive.
Streamline the Pull Request Process
Let’s be honest: the code review stage is often the biggest traffic jam in the whole development process. A pull request (PR) that just sits there for days doesn’t just delay a feature; it forces developers into expensive context switching when they finally have to revisit it.
To fix this, you need to set clear ground rules for your review process.
- Set a Time Target: Aim for all PRs to get their first review within a set timeframe, like 24 hours. This simple rule creates a culture of responsiveness.
- Keep PRs Small: Make small, focused PRs a non-negotiable practice. Reviewing 100 lines of code is worlds easier and more effective than trying to wrap your head around 1,000.
- Automate Linting and Style Checks: Use tools to automatically handle the simple stuff like code style and syntax. This frees up your human reviewers to focus on what matters: the logic and architecture.
Invest in CI/CD Automation
Manual steps are a breeding ground for delays and human error. Every time a developer has to wait for a manual build, a manual test run, or a manual deployment, your cycle time ticks up.
A solid Continuous Integration/Continuous Deployment (CI/CD) pipeline is an absolute must-have for any modern, efficient team. Automating these steps makes sure code is tested and deployed consistently and quickly, cutting out those painful waiting periods from the workflow. Implementing advanced solutions, like AI automation for workflow optimization, can seriously streamline these processes and slash cycle time.
This investment also frees up your developers from mind-numbing administrative work, letting them focus on what they do best—building great software. Research from across the industry backs this up. Improving cycle time usually boils down to three main levers: better task scoping, more focused coding time, and smoother collaboration. When you automate repetitive tasks and break work into smaller pieces, you’re directly improving all three. For more on how these factors affect project outcomes, check out this analysis from Betabreakers.
Common Questions About Cycle Time
Even after you get the hang of what cycle time is, a few practical questions always seem to pop up. Let’s walk through some of the most common ones teams ask when they start tracking this metric.
What’s a Good Cycle Time for a Software Team?
Honestly, there’s no magic number. A “good” cycle time is completely dependent on your team, the kind of problems you’re solving, and your tech stack.
Instead of chasing some industry benchmark you read about online, focus on understanding your own baseline. The real goal isn’t to hit a specific number; it’s to become consistent, predictable, and to see that cycle time trend gently downwards over time.
Should We Use Cycle Time in Performance Reviews?
This is a hard no. Cycle time is a team metric, not a developer metric.
It’s meant to diagnose the health of your process, not the output of an individual. Using it for performance reviews is a recipe for disaster. It encourages all the wrong behaviors, like rushing code, skipping QA, or only grabbing the easiest tickets. Keep it focused on improving the team’s workflow, period.
How Do AI Coding Assistants Affect Cycle Time?
This is where things get interesting. AI assistants like GitHub Copilot can have a huge impact by speeding up the “coding” part of the process. They’re great at handling boilerplate, spotting simple bugs, and even generating test cases.
By cutting down the time a task spends in that active coding phase, these tools can directly lower your overall cycle time. It’s one of the clearest ways to help your team get from “In Progress” to “Done” a whole lot faster.
Ready to see how your AI tools are actually impacting your workflow? Zest gives you automatic insights into your team’s cycle time, bottlenecks, and AI usage, right from your editor. See how top teams ship faster at meetzest.com.
Optimize Your Delivery Flow
Turn these insights into action to build a faster, more predictable, and more efficient development process.
📊 Core Metrics
- Cycle Time Trend — Is the average time from 'In Progress' to 'Merged' consistently decreasing?
- PR Review Wait Time — How long does a pull request sit idle before the first review?
- Throughput Rate — How many tasks is the team completing per week or sprint?
🕹️ My Cheatcodes
- 🌱 Measure the System — Treat cycle time as a diagnostic for your process, not a performance metric for people.
- 🦎 Shrink the Work — Break large epics into small, two-day stories that flow through the system quickly.
- ⚡ Automate the Gates — Use CI/CD to eliminate manual testing and deployment waits, a common bottleneck.
✅ Before Your Next Sprint
- 🔍 Identify the one stage where work waits the longest.
- 📊 Set a team-wide target for first PR review time (e.g., <24 hours).
- 🧭 Break down the largest task in your backlog into smaller pieces.
- 📈 Confirm automated checks are handling linting and basic style.
Gallery
Lemon shots



