
Define Cycle Time A Guide to Faster Software Delivery

In software development, cycle time measures the total time from the moment a developer pulls a task into the ‘In Progress’ column until that task is live in production. It’s the clock on the wall for active work—from the first line of code to the final deployment.
What Does Cycle Time Mean in Software Development

Let’s break it down with a simple analogy. Think of your development team as a pizza shop. The moment an order ticket is handed to the kitchen, the cycle time clock starts ticking. It keeps running as the dough is stretched, toppings are added, the pizza is baked, and it’s finally placed in the box for delivery. It stops only when the pizza is ready to go out the door.
What happens before the ticket hits the kitchen—the customer deciding what to order—doesn’t count. It’s all about the active “making” process. This focus is precisely what makes cycle time such a potent metric for engineering teams. It measures execution speed, not wait time.
The Basic Formula for Cycle Time
At its heart, the calculation is incredibly simple. It measures the real-world time it takes to complete a task, including any delays, blockers, or weekend pauses that happen once work has begun.
Cycle Time = Work End Time – Work Start Time
This formula gives you the total calendar time. It doesn’t sugarcoat reality by excluding weekends or the time a task sits waiting for a code review. It reflects the genuine journey of a piece of work, warts and all, which is what makes it so useful.
Why It’s a Critical Pulse Check
Monitoring cycle time is like giving your development process a regular health checkup. It surfaces the answers to critical questions that are often hard to quantify:
- How fast are we, really? It cuts through the noise and shows your team’s actual capacity to ship features and fixes.
- Where are our bottlenecks? A sudden jump in cycle time is a blaring alarm, often pointing to a snag in your code review process, testing delays, or an overly complex deployment pipeline.
- Can our stakeholders trust our estimates? Consistent cycle times allow you to forecast delivery dates with confidence, moving away from gut-feel estimates to data-backed predictions.
A low and stable cycle time is a hallmark of a healthy, high-performing team. It means you can get ideas into the hands of customers quickly and reliably. This isn’t always easy; a recent survey found that for nearly 40% of developers, it takes one to two weeks to move code from an idea to production. You can read more about these common hurdles in the 2023 survey report.
How to Measure Cycle Time Accurately
So, how do you actually measure cycle time? It all starts with getting crystal clear on your start and end points. Think of it like a stopwatch for your development process. The clock doesn’t begin when someone has a good idea; it starts the moment a developer actually pulls a task and begins working on it.
This “start gate” is usually a specific action in your project management tool. For instance, the second a ticket gets dragged from ‘To Do’ into ‘In Progress’ on a Jira board—that’s when the timer kicks off.
The “end gate” is just as important. For most teams, this is when a pull request is merged into the main branch. For others, it might be when the code is live in production. The key isn’t which one you choose, but that everyone on the team agrees and sticks to the same definitions for every single task. Consistency is everything.
Pinpointing Your Start and End Gates
Picking your measurement gates is the most important decision you’ll make. If your team doesn’t have a shared understanding of what “started” and “done” mean, your data will be messy and, frankly, useless.
Here are a few common triggers teams use:
- Start Point: The timestamp when a task’s status flips to ‘In Progress,’ ‘Development,’ or something similar.
- End Point: The timestamp when code is merged, passes all CI/CD checks, or is live for customers.
Once you have those locked in, the math is simple: end time minus start time. If you want to dive deeper into the nuts and bolts, this is a great resource on how to accurately calculate cycle time for your specific workflow.
Using Control Charts to Visualize Your Rhythm
Calculating the cycle time for a single task is useful, but the real magic happens when you see the data over time. This is where a control chart comes in. A control chart is a simple scatter plot that maps out the cycle time for every task your team completes.
A control chart is more than just a graph of numbers. It tells a story about your team’s predictability. It shows you the natural rhythm of your delivery, highlighting both your consistency and the outliers that need a closer look.
By plotting each task, you can immediately spot your average cycle time and, more importantly, see which tasks took way longer than everything else. Those outliers are gold—they’re your starting point for conversations about what went wrong and how to fix it.
Most modern tools, like GitHub and Jira, can generate these charts for you right out of the box. This turns a spreadsheet of abstract data into a powerful, visual snapshot of your team’s health, letting you make decisions based on what’s actually happening, not just a gut feeling.
Cycle Time vs. Lead Time vs. Throughput
In the world of software development, we hear a lot of terms thrown around to measure how a team is doing. Three of the most common—and most commonly confused—are cycle time, lead time, and throughput. Each one tells a very different story about your workflow. Getting them straight is the first step to figuring out what’s working and what’s holding you back.
Let’s use a simple analogy: imagine you run a pizza shop.
The moment a customer places an order, the clock starts on lead time. This metric covers the entire journey from the customer’s perspective, from the initial “I’m hungry” to the pizza arriving at their door. It includes the time the order sits in the queue before your kitchen staff even sees it.
Once your chef grabs the ticket and starts tossing the dough, a new clock starts: cycle time. This is the “hands-on” part. It measures how long it takes to prep the ingredients, bake the pizza, and put it in the box. It’s a pure measure of how efficient your kitchen is.
Finally, throughput is just the total number of pizzas you get out the door by the end of the night. It’s a simple count of your output.
This flow is what makes cycle time such a powerful metric for your internal process. It’s all about the active work.
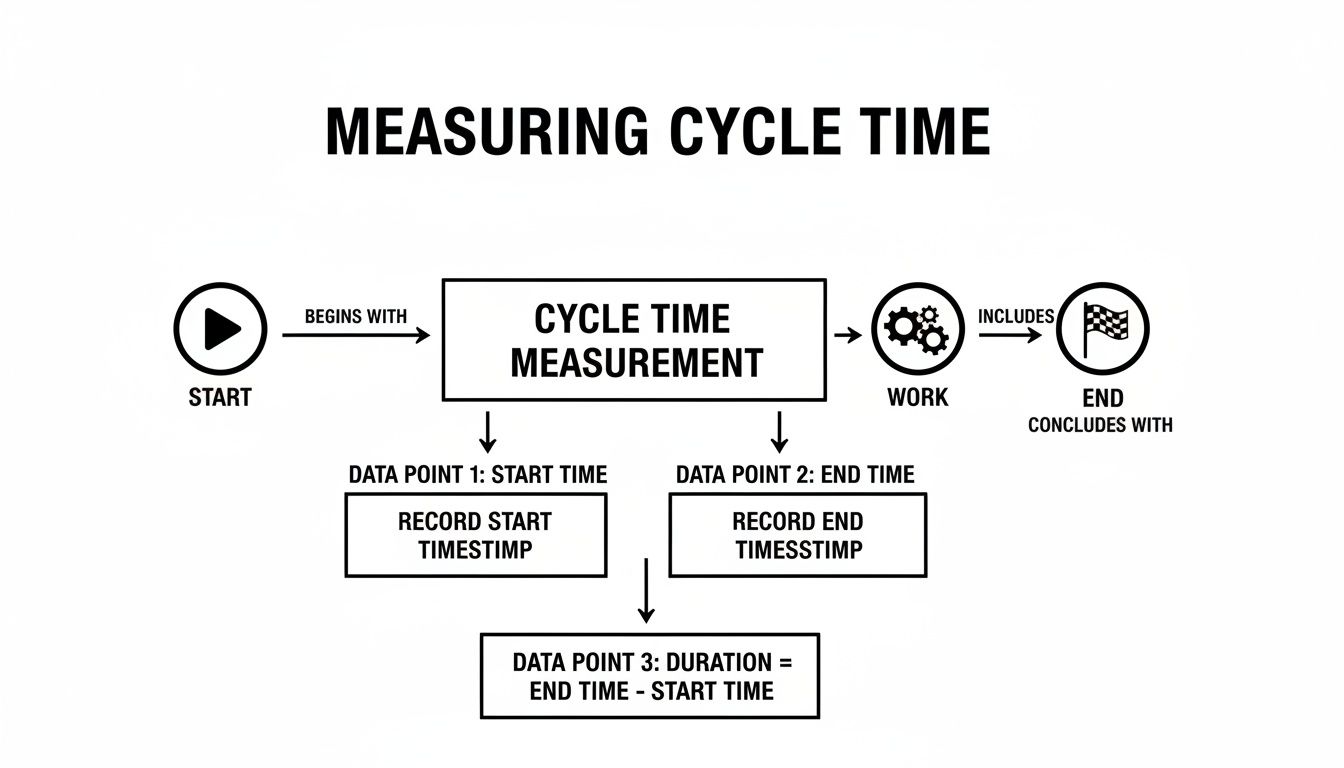
As the chart shows, cycle time is laser-focused on the duration of active work, neatly bookended by a clear start and finish. This makes it an incredibly useful tool for finding and fixing bottlenecks within your team’s process.
What Each Metric Reveals
These metrics are not interchangeable. They answer very different questions, and if you mix them up, you could end up trying to “fix” a part of your process that isn’t actually broken.
Think about it: if you have a long lead time but a short cycle time, the problem isn’t your developers. It means work is piling up and getting stale in the backlog before anyone even starts coding. Your team is fast, but your planning process is slow.
Knowing the difference is everything. You can dive deeper into lead time for software teams to see how it fits alongside cycle time to give you the full picture.
To make it even clearer, let’s put them side-by-side.
Comparing Key Delivery Metrics
Here’s a direct comparison of these three critical software delivery metrics to clarify what they measure and where they fit in your workflow.
| Metric | What It Measures | Typical Start Point | Typical End Point |
|---|---|---|---|
| Cycle Time | The time it takes to complete a task once active work has begun. | A ticket is moved to “In Progress.” | Code is merged or deployed. |
| Lead Time | The total time from a request being made to it being delivered to the customer. | A ticket is created in the backlog. | The feature is live for users. |
| Throughput | The number of work items completed within a specific time period. | The start of a time period (e.g., a week). | The end of the time period. |
By keeping an eye on all three, you get a much richer, more complete view of your entire delivery pipeline. It helps you quickly diagnose whether delays are caused by slow development (high cycle time), a messy backlog (high lead time), or a team that’s simply over-capacity (low throughput).
Finding the Bottlenecks That Inflate Cycle Time
Once you start measuring cycle time, you’ve taken the first step. But the real magic happens when you use that data to figure out what’s actually slowing you down.
Think of your development process like a series of pipes. If the water pressure suddenly drops, you know there’s a clog somewhere. Your job is to find it. Bottlenecks are those hidden friction points that quietly tack on days—or even weeks—to your delivery schedule.
These delays are rarely obvious. They show up as pull requests sitting un-reviewed for days, work getting stuck waiting on another team, or clunky testing processes that force endless rework. Learning to spot these specific pain points is how you go from just watching numbers on a dashboard to actively clearing the roadblocks.
Common Culprits of High Cycle Time
Most teams run into the same handful of classic bottlenecks. The trick is figuring out which ones are hurting your team’s flow so you can make changes that actually matter.
Here are the usual suspects:
- Long Code Review Queues: This is probably the biggest one. A pull request that sits idle waiting for a review is just dead time. It kills the developer’s momentum and forces a painful context switch when feedback finally comes in.
- Vague or Shifting Requirements: When a ticket’s goal is fuzzy, developers get stuck in a frustrating loop: code something, get feedback that it’s not quite right, and start over. All that rework directly blows up your cycle time.
- External Dependencies: Any time you’re waiting on another team for an API, a design, or even just an approval, you’re playing a waiting game. If that team has different priorities, your work is completely stalled, and it’s totally out of your control.
- Inefficient Testing: Slow, manual, or flaky tests are a massive drag. When developers have to wait hours for a test suite to run, or if tests fail for no good reason, the whole delivery pipeline grinds to a halt.
These aren’t just minor annoyances; they’re systemic problems with serious consequences. Look at the data on project failures—there’s a clear line between these kinds of process issues and projects going off the rails. In fact, a staggering 52% of project failures are tied to things like poor communication and changing requirements, which are exactly what cause high cycle time.
The point isn’t to blame anyone. It’s to see the process as a system. A long code review queue isn’t a person’s fault; it’s a process problem. Maybe the fix is setting aside dedicated review time or agreeing on smaller PRs.
By getting to the root of these issues, you can start making smart, targeted improvements. To get the data you need to start this diagnosis, you can learn more about calculating cycle time in our detailed guide.
Shorten Cycle Time With AI-Powered Workflows
Let’s be honest: AI coding assistants are no longer a gimmick. Tools like GitHub Copilot are quickly becoming a standard part of the engineering toolkit, and they’re having a huge impact on how fast teams can ship software. Every stage of the development cycle is getting shorter because of it.
This isn’t just a small bump in speed. The latest AI-assisted coding tools are projected to boost developer productivity by a staggering 20-40%. That’s a massive shift in what we can expect from our development cycles.
AI is basically an accelerant for your team. By handling the grunt work—the repetitive, time-sucking tasks—it frees up your developers to actually focus on the hard problems. This is more than just a minor tweak; it’s a complete overhaul of the old workflow.
How AI Compresses Each Development Phase
You can feel AI’s influence across the entire process, from writing the first line of code to squashing the last bug. Each little bit of help shaves time off the total cycle.
Here’s a quick breakdown of where AI assistants are making a real difference:
- Code Generation: Instead of manually typing out boilerplate code, developers can now generate it with a simple prompt. Think about setting up new components or creating data models—what used to take hours of tedious work can now be done in minutes.
- Automated Testing: We all know writing good unit tests is crucial, but it can be a real drag on momentum. AI tools can now generate test cases based on the code you’ve written, helping you get better coverage without slowing everyone down.
- Accelerated Debugging: When a developer gets stuck, AI can be a lifesaver. It can suggest potential fixes, explain cryptic error messages, or untangle confusing code snippets. This dramatically cuts down the time spent staring at a screen, completely blocked.
If you’re serious about shortening your cycle time, digging into different intelligent automation use cases is a great way to see how you can weave AI even deeper into your team’s day-to-day work.
The Missing Piece: Measuring AI’s Impact
Simply giving your team a new AI tool isn’t a magic bullet. If you can’t measure its impact, you’re just guessing. How do you actually know if it’s helping? Where are people still getting stuck?
This is where a dedicated workflow manager becomes essential. It gives you the visibility to turn AI adoption into a real, measurable reduction in cycle time. It’s the difference between just having a tool and actually mastering it.
An AI-native measurement layer gives you insights that you just can’t get from standard project management tools. It can track the time saved on AI-assisted tasks, flag when a developer is struggling (like trying the same prompt over and over), and help you standardize prompting patterns that actually work. This data is gold—it helps you fine-tune the partnership between your developers and their AI assistants.
The end goal is a tight feedback loop where you can see exactly how AI is improving your team’s productivity for developers. When you can put numbers to the impact, you can refine your strategy, share what works, and make sure you’re getting every bit of value out of your investment in AI.
Actionable Strategies to Reduce Your Team’s Cycle Time

Knowing what’s slowing you down is one thing, but actually fixing it is a whole different ball game. To really shrink your cycle time, you need a playbook of real-world tactics your team can start using right away. The goal isn’t just to move faster; it’s to create a smooth, predictable flow by systematically rooting out friction.
This isn’t about cracking the whip and telling developers to code faster. It’s about optimizing the entire system so that work glides from “in-progress” to “done” with as few bumps as possible. These battle-tested strategies will help you build a culture of sustainable, continuous improvement.
Break Down Large Epics
One of the most powerful things you can do to shorten cycle time is to get really good at breaking work down. Giant, monolithic features are a classic trap. They’re a nightmare to estimate, a beast to review, and incredibly risky to deploy, causing your cycle time to balloon.
Instead, slice those big epics into small, self-contained tasks. Each tiny piece moves through your workflow quickly, gets reviewed in minutes (not days), and can be deployed on its own. This creates a much faster feedback loop and gives the whole team a sense of momentum.
Implement CI/CD and Automation
Manual steps are the natural enemy of a short cycle time. Every single time a developer has to stop their flow to manually run tests, build the code, or push a deployment, the clock is ticking. A solid Continuous Integration/Continuous Deployment (CI/CD) pipeline takes all that off their plate.
Once a pull request is merged, an automated workflow can take over—building, testing, and deploying the code without any human hand-holding. This not only crushes manual delays but also makes your release process consistent and reliable, freeing up your developers to focus on the next problem.
Adopting a culture of small, frequent releases is a cornerstone of reducing cycle time. It minimizes risk, accelerates feedback, and keeps the entire development process moving smoothly.
Streamline the Code Review Process
Let’s be honest: code review is often the biggest bottleneck in the whole process. A pull request that just sits there for days is pure waste. To fix this, set clear service-level objectives (SLOs) for code reviews. For example, your team might agree that every pull request gets its first review within 24 hours.
Also, push for smaller pull requests. No one wants to review a PR with hundreds of lines of changes; it’s intimidating and mentally taxing. But a PR with just 30-50 lines? That’s easy to understand and approve quickly. This keeps work flowing and stops both the author and the reviewer from getting bogged down.
Use Feature Flags for Decoupled Releases
Finally, feature flags are an absolute game-changer for separating deployment from release. This practice lets you merge and deploy new code into your production environment while keeping it hidden from actual users.
With feature flags, you can ship incomplete features without anyone ever knowing. This completely decouples your development team’s pace from the marketing or business launch schedule, allowing for a constant stream of small deployments and dramatically shorter cycle times.
Answering Your Top Questions About Cycle Time
Even after you’ve got the basic definition down, some common questions always pop up when teams first start digging into their development process. Let’s tackle a few of the most frequent ones to clear up any confusion and get you on the right track.
What’s a Good Cycle Time for a Software Team?
Honestly, there’s no magic number. A “good” cycle time is simply one that is predictable and trending downward for your team and your projects.
Don’t get caught up chasing some universal industry benchmark. The real goal is to reduce wild swings in your delivery times. A team that consistently ships features in 3-5 days is in a much healthier spot than a team that ping-pongs between one day and ten days, even if their averages look similar. Consistency is king here—it shows you have a stable, reliable process.
Does Cycle Time Include Code Review or QA Testing?
Yes, it absolutely does. Cycle time is meant to capture the entire active development window.
The clock starts the moment a developer picks up a ticket and begins coding. It only stops when that code is merged and ready for deployment—whatever “done” means for your team. This includes all the back-and-forth of code reviews, QA testing, and any rework that happens along the way. It’s the full journey from “in progress” to “ready to ship.”
How Is Cycle Time Different From Story Points?
They measure two completely different things. Story points are an estimate—a guess about the effort and complexity of a task before anyone starts working on it.
Cycle time, on the other hand, is a direct measurement of how long a task actually took to complete. Think of it this way: story points are the forecast, while cycle time is the weather report. While estimates are useful for planning, cycle time gives you hard data on how your process truly performs, which is far more reliable for predicting when future work will be finished.
Ready to stop guessing and start measuring? Zest provides AI-native visibility into your development workflow, helping you pinpoint bottlenecks and shorten your cycle time with data, not just intuition. Learn more at https://meetzest.com.
Mastering Cycle Time: Key Takeaways
Use these core ideas and reflection points to turn your new understanding of cycle time into real improvements for your team.
📊 Core Metrics to Watch
- Cycle Time Consistency: How predictable are your delivery times? Stability matters more than raw speed.
- Time in Each Phase: How long do tasks sit in “In Progress” versus “In Review”? This helps you find your specific bottlenecks.
- Outlier Frequency: How often do tasks take way longer than your average? This can point to hidden problems in your process.
🕹️ My Pro-Tips
- 🌱 Measure Reality, Not Estimates: Cycle time is what actually happened. Story points are just a prediction. Always trust the data.
- 🦎 Define ‘Done’ First: This metric is useless if your team doesn’t agree on exactly when the clock starts and stops. Get aligned.
- ⚡ Consistency Over Speed: A predictable 4-day cycle is much better than a chaotic process that swings between 1 and 10 days.
📈 Questions to Ask Your Team
- 💡 Does our definition of “done” really include all the active work, like testing and code review?
- 🧩 Are we getting distracted by an industry benchmark instead of focusing on our own team’s consistency?
- 📘 Is our focus on story points hiding how long our work is actually taking?
Master Your Cycle Time
Use these core ideas to turn your understanding of cycle time into tangible process improvements for your team.
📊 Core Metrics
- Cycle Time Consistency — The predictability of your delivery times; stability is key.
- Time in Phase — The duration tasks spend in specific stages like 'In Progress' vs. 'In Review'.
- Outlier Frequency — The rate at which tasks significantly exceed the average cycle time.
🕹️ My Cheatcodes
- 🌱 Define Gates First — Agree on the exact 'start' and 'end' points before tracking anything.
- 🦎 Slice Ruthlessly — Break large epics into small tasks that can be completed and reviewed quickly.
- ⚡ Measure Reality, Not Estimates — Trust actual cycle time data over predictive story points.
📈 Reflection Points
- 💡 Where does work sit idle the longest in our process? (e.g., code review queue)
- 🧩 Is our definition of 'done' consistently applied by every team member?
- 📘 Are we prioritizing raw speed over a predictable, stable delivery rhythm?
Gallery
Lemon shots



