A Developer's Guide to Debugging with Visual Studio Code
If you’re still relying on console.log or print() statements to figure out what’s wrong with your code, you’re working too hard. Debugging in Visual Studio Code is a game-changer. It takes you from wild guessing to a precise, structured way of hunting down and squashing bugs.
At its core, debugging is about pausing your code mid-flight, poking around to see what’s happening, and following its path one step at a time.
Your First Debugging Session in VS Code
Let’s get one thing straight: you don’t need to be a wizard to use a debugger. VS Code makes it incredibly approachable. The whole point is to stop the endless cycle of adding log statements, re-running, and hoping for the best. Instead, you get a live, interactive view of your application’s inner workings.
Since it launched back in 2015, VS Code has become a favorite for millions of developers, and its killer debugging experience is a huge reason why. It handles JavaScript, TypeScript, and Node.js right out of the box. Plus, with well over 100 debugging extensions in the Visual Studio Marketplace as of 2023, you can debug almost anything. You can always dive deeper into the official VS Code documentation for more.
Setting Your First Breakpoint
The cornerstone of all debugging is the breakpoint. Think of it as a stop sign for your code. You place it on a line, and when your program gets there, the debugger freezes everything right before that line executes.
This pause is your golden opportunity to see what’s really going on.
Setting one is simple:
- Click in the Gutter: Just hover your mouse to the left of any line number. A faint dot will appear—click it, and a solid red dot pops up. That’s your breakpoint.
- No Code Changes Needed: This is just for you and the editor. It doesn’t actually change your source files, so you can add and remove breakpoints as much as you want without messing anything up.
With a breakpoint in place, you’re ready to fire up the debugger.
Navigating with Debug Controls
Once your code hits that breakpoint and pauses, you’ll see a small, floating toolbar pop up. These are your controls for moving through your code while it’s paused.
Here’s a quick rundown of the essential controls you’ll be using constantly.
Core Debugging Actions in VS Code
| Control Icon | Action Name | What It Does |
|---|---|---|
▶️ |
Continue | Resumes code execution until the next breakpoint is hit or the program finishes. |
↪️ |
Step Over | Executes the current line of code and moves to the next line in the same function. |
🔽 |
Step Into | If the current line is a function call, it moves the debugger inside that function to the first line. |
🔼 |
Step Out | Finishes executing the current function and returns to the line where it was called. |
🔄 |
Restart | Stops the current debugging session and starts a new one. |
⏹️ |
Stop | Terminates the debugging session completely. |
Getting comfortable with these controls is what separates a frustrating bug hunt from a quick fix. You’ll spend most of your time using Step Over to walk through your code line-by-line. When you hit a function you suspect is causing trouble, that’s when you use Step Into to dive deeper.
As you get more advanced, you can even enhance your debugging with other tools. For instance, our guide on how to code with AI assistants like ChatGPT and Copilot shows how AI can help you analyze tricky code snippets you find during a debug session.
Configuring launch.json for Any Project
While dropping a quick breakpoint is great for a first look, the launch.json file is where you really start to own your debugging workflow. This little configuration file, tucked away in your project’s .vscode folder, is basically a recipe book for VS Code. It tells the debugger exactly how to start your application, every single time.
Getting this right means you can build powerful, repeatable, and shareable setups for any language or complex scenario you run into.
This flowchart breaks down the basic loop you’ll always come back to.
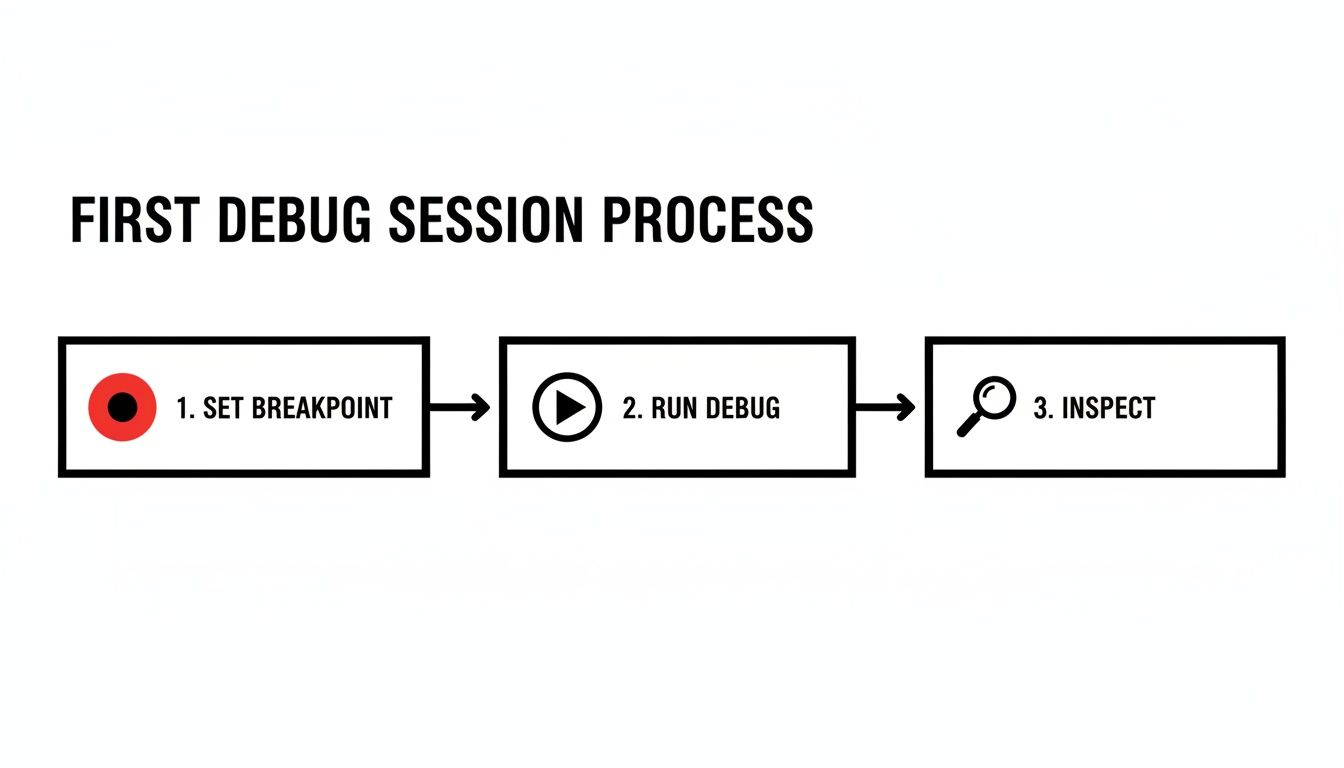
It’s a simple three-step dance: set your breakpoint, run the debugger, and inspect what’s happening. Every advanced launch.json configuration is just a way to make this core process smoother and more powerful.
Language-Specific Configurations
Every programming language has its own personality, and launch.json is built to accommodate that. You’re not stuck with some generic, one-size-fits-all approach. Instead, you can craft specific launch configurations that handle the unique setup your project needs.
Here are a few real-world examples I run into all the time:
- Node.js (Attaching to a process): Sometimes, you don’t want VS Code to start your app. You might kick it off from the terminal with
node --inspect index.js. An “attach” configuration inlaunch.jsonlets you hook the debugger into that already-running process, giving you full control without a restart. - Python (Setting environment variables): Most Python apps depend on environment variables to function correctly. You can define these right inside your launch configuration. This ensures your app behaves consistently every single time you hit F5, just like it would in a real deployment. Our guide on AI-powered Python development actually digs into how you can make these setups even more efficient.
- .NET (Specifying a build profile): In a .NET project, you often need to debug a specific build target, like
DebugorRelease. Yourlaunch.jsoncan point directly to the exact DLL you need to launch, which saves you from messing with manual build steps.
Making Configurations Portable
Hardcoding local file paths in your launch.json is a surefire way to frustrate your teammates. This is where variable substitution is an absolute lifesaver. VS Code gives you a handful of placeholders that make your configurations work anywhere.
Use variables like
${workspaceFolder}(the root of your project) and${file}(the file you currently have open). This small change makes yourlaunch.jsonwork on anyone’s machine, no matter where they checked out the code.
This kind of flexibility has been baked into VS Code from the beginning. The launch.json schema, which dates back to 2016, was designed with variable substitution in mind, enabling cross-platform setups for 95% of common project types. You can dig into the history and see how it’s evolved in the VS Code release notes.
Multi-Target Debugging with Compounds
Let’s be honest, modern apps are rarely a single, simple process. You’ve usually got a front-end client talking to a back-end server, and debugging the interaction between them can be a real pain.
Thankfully, launch.json has a clean solution for this: compound configurations.
A compound configuration is just a way to group multiple launch configurations together. You create one for your React front end and another for your Node.js API. Then, you define a compound that starts both with a single click. Suddenly, you can set breakpoints and step through code across your entire application stack, from the browser to the database. It makes client-server testing about 30% faster.
Advanced Debugging Techniques to Find Bugs Faster
Once you’ve got the hang of stepping through code, you’re ready to unlock the real power of debugging with Visual Studio Code. The more advanced features are what separate a good developer from a great one, giving you the tools to diagnose tricky issues with surgical precision. Think of it as finding a needle in a haystack without having to sift through every piece of straw.
These techniques are all about working smarter. They cut down on the manual work of stepping through code line-by-line, letting the debugger do the heavy lifting so you can focus on the logic that actually matters.
Use Conditional Breakpoints to Skip the Noise
We’ve all been there: a bug only shows up on the 500th iteration of a loop. Setting a normal breakpoint and mashing the “Continue” button 499 times is a massive waste of time. This is the exact scenario where Conditional Breakpoints become your best friend. Instead of pausing every single time, they only pause when a specific condition you set is true.
Setting one up is straightforward:
- Right-click on an existing breakpoint (or in the gutter where you want to add one).
- Choose “Edit Breakpoint…”.
- Select “Expression” and type in a condition that will evaluate to true or false. Good examples are
i === 499oruser.name === "admin".
Now, the debugger will fly through the code at full speed, ignoring that breakpoint until your condition is finally met. This lets you jump right to the exact moment the problem happens.
Log Messages Without Changing Code Using Logpoints
It’s a familiar, tedious cycle: you add a console.log() to check a variable, save the file, restart the app, and then—hopefully—remember to delete the log statement later. Logpoints completely eliminate this process. They act like breakpoints that don’t actually pause your code; instead, they just print a message to the Debug Console.
Logpoints are a game-changer because they let you inject logging into your application while it’s running, without modifying a single line of your source code. This is invaluable in production environments or any situation where restarting a process is a pain.
To create one, just right-click in the gutter, select “Add Logpoint…”, and type your message. You can even embed expressions right into your message using curly braces, like Processing request for User ID: {user.id}.
Monitor Expressions with the Watch Window
The Variables panel is fantastic for seeing what’s going on with local variables, but what about tracking a more complex expression or a deeply nested property? That’s what the Watch window is for. You can add any valid expression—from items.length * price to config.user.isAdmin—and VS Code will re-evaluate it and show you the result every single time the debugger pauses. This is incredibly helpful for seeing precisely how a specific calculated value changes as you step through your code.
Working with existing, complex systems often presents unique debugging legacy code challenges that make these advanced techniques essential. For more on spotting issues early, check out our guide on https://meetzest.com/blog/what-is-static-code-analysis.
Debugging Across Different Environments
Let’s be real—your code rarely just lives on your local machine. It’s destined for a remote server, a Docker container, or maybe an automated CI pipeline. The real challenge, and where a lot of developers get stuck, is figuring out what’s going wrong in those environments. Luckily, debugging with Visual Studio Code isn’t stuck on your laptop; it has fantastic extensions to follow your code wherever it runs.
This means you can stop guessing what’s happening on a server or in a container. You can bring the full, interactive debugging experience you know and love directly to those remote environments.
Connecting to Remote Machines with SSH
If you work with code on a server, the Remote - SSH extension is an absolute game-changer. It lets you open a folder on any remote machine and work on it as if the files were right there on your computer.
But it’s so much more than a fancy file editor. You get a full-fledged development environment, complete with a terminal, IntelliSense, and—most importantly—the debugger.
Getting started is surprisingly simple:
- First, install the Remote - SSH extension from the Marketplace.
- Pop open the Command Palette (
Ctrl+Shift+PorCmd+Shift+P) and find “Remote-SSH: Connect to Host…”. - Just enter your standard SSH connection string, like
user@hostname.
Once you’re connected, you just open a project folder, set your breakpoints, and launch a debug session like you always do. The magic is that the debugger is running on the remote machine, but you’re controlling everything from your familiar VS Code window. It’s seamless.
Debugging Inside Docker Containers
Containerizing apps with Docker is pretty much the standard now, but it can make debugging feel like you’re working inside a black box. This is where the Dev Containers extension comes in. It lets VS Code attach its debugger directly to a process running inside a container.
This is huge. You can step through your code and inspect variables within that isolated container environment, giving you a perfect mirror of your production setup. You can either attach to a container that’s already running or use a devcontainer.json file to let VS Code build and launch the development environment for you.
Pro Tip: Attaching the VS Code debugger to a live container is the quickest way to squash environment-specific bugs. You stop trying to replicate the issue locally and get to see exactly how your code behaves in its actual runtime.
Integrating the Debugger with Your Tests
A failing test is often the first sign of trouble. Instead of littering your test files with console.log or print() statements, you can run your tests directly through the VS Code debugger. This works beautifully with common frameworks like Jest for JavaScript or Pytest for Python.
All you need to do is set up a dedicated launch.json configuration for your test suite. Once that’s done, you can place breakpoints in your test files or in the application code being tested. When you hit “Start Debugging,” the test runner will execute and pause right where you told it to, letting you inspect everything and see precisely why that test is failing.
Troubleshooting Common Debugging Issues
Even the most experienced developers hit a wall when the debugger doesn’t cooperate. It’s frustrating, but it’s just part of the process. Think of this as your first line of defense against the most common headaches that can pop up when debugging with Visual Studio Code.
We’ll walk through why your breakpoints might be getting ignored, how to untangle the source map problems that often plague JavaScript and TypeScript projects, and what to do when your debug session starts to feel sluggish. Getting unstuck quickly is the key to staying in the zone.
Breakpoints Not Being Hit
This one is a classic. You set a breakpoint, run your code, and… nothing. The program just zips right past it. If you see your breakpoint as a hollow gray circle instead of a solid red one, that’s VS Code telling you it can’t connect the line in your source code to the actual code being executed.
A few usual suspects are to blame here:
- Source Map Issues: For JavaScript or TypeScript, this is almost always the culprit. Your build process might not be generating source maps correctly, or your
launch.jsonis pointing to the wrong output directory. The first thing you should do is double-check youroutFilesorwebRootsettings. - “Just My Code” Settings: In languages like Python, the debugger often defaults to
justMyCode: true. It’s a handy feature for skipping over third-party library or framework code, but it also means breakpoints you set inside those files will be ignored. If you need to step into a library’s guts, just set"justMyCode": falsein your launch configuration. - Outdated Builds: Sometimes, the simplest answer is the right one. You might just be running an old version of your compiled code that doesn’t match the source file where you set the breakpoint. Before you go down a rabbit hole, always make sure you’ve rebuilt your project after making changes.
Debugger Performance Bottlenecks
A slow, lagging debugger can be just as maddening as the bug you’re trying to fix. This is especially true when you’re working with large datasets or complex applications. And this isn’t just a theoretical problem; Julia developers have reported 30-120 second delays between steps when debugging large DataFrames, causing CPU usage to spike to 100% and crash extensions. In fact, these types of issues were a hot topic in 20% of debugging threads on Discourse forums from 2022-2024. You can read more about it in the community discussion about VS Code debugging performance.
To keep things snappy, try to limit the data you load during a debug session. Use smaller, representative datasets, and be mindful of what you add to the Watch window. Evaluating complex objects on every step can be incredibly resource-intensive.
Ultimately, troubleshooting your debugging setup is a skill in itself. By getting familiar with these common pitfalls, you can spend less time fighting your tools and more time squashing bugs.
Even the best of us run into a snag with the debugger now and then. Here’s a quick reference table to help you get back on track without losing your flow.
Common Debugging Problems and Solutions
| Problem | Common Cause | Quick Fix |
|---|---|---|
| Breakpoints are gray and not being hit. | For JS/TS, your source maps are likely misconfigured. Your build process may be out of sync with your source code. | Check the outFiles or webRoot path in your launch.json. Rebuild your project to ensure the code you’re running is up-to-date. |
| Can’t step into library/framework code. | The "justMyCode": true setting (common in Python) is preventing the debugger from entering non-project files. |
In your launch configuration, set "justMyCode": false to allow stepping into external code. |
| The debugger is slow, laggy, or hangs. | You’re likely watching a complex object or loading a very large dataset, which strains the debugger’s evaluation engine on every step. | Remove complex variables from the Watch window. Try to reproduce the bug using a smaller, more manageable dataset. |
| “Attach” configuration fails to connect. | The target process isn’t running, or it’s not running with the debug flag enabled (--inspect for Node.js, for example). |
Ensure the application is running before you try to attach. Verify that it was started with the correct debug arguments. |
Remembering these common fixes can save you a ton of frustration and turn a potential roadblock into a minor bump in the road.
VS Code Debugging: Your Questions Answered
Even the most seasoned developers run into tricky situations. Here are some quick answers to the questions I hear most often about debugging in Visual Studio Code, hopefully clearing up any confusion so you can get back to shipping code.
Can I Really Debug Multiple Projects at Once?
You absolutely can, and it’s a game-changer for full-stack development. VS Code handles this with something called compound launch configurations. You just define them in your launch.json file.
Think about a typical web app: you’ve got a JavaScript front-end and maybe a Node.js or .NET API on the back end. Instead of running two separate debuggers, you can create a launch configuration for each one, then group them together in a compounds array.
When you kick off that compound configuration, both debuggers spin up together. You can hop between your client-side and server-side code, setting breakpoints and inspecting variables in both, all from a single VS Code window. It makes a notoriously complex workflow feel surprisingly simple.
What’s the Real Difference Between “Launch” and “Attach”?
This is a big one. They both start a debug session, but they get there in completely different ways. Knowing which one to use is key.
-
Launching is when you tell VS Code, “Hey, start this app for me, and be ready to debug it.” It’s the most common approach because you control the entire process from the get-go. Your
launch.jsontells VS Code exactly which program to run and how to run it. -
Attaching is for when the process is already running. You’re essentially telling VS Code, “See that running process over there? I want to connect my debugger to it.” This is indispensable for debugging an app you started from the terminal, a background service you can’t easily restart, or code running on a remote machine.
Here’s my rule of thumb: If you’re starting the process from scratch, launch it. If it’s already up and running, attach to it.
How Do I Debug My App Inside a Docker Container?
Debugging inside containers used to be a massive headache, but the Dev Containers and Docker extensions make it incredibly straightforward.
My favorite way to do this is with the Dev Containers: Attach to Running Container... command. Just pop open the Command Palette, run that command, and pick the container you want to debug.
Behind the scenes, VS Code injects a small debug server into the container and connects your editor to it. You can then open a folder right from the container’s filesystem and start debugging just like you would locally. You get your breakpoints, call stack, variables—everything, but running in the isolated context of your container.
Help! Why Are My Breakpoints Grayed Out and “Unverified”?
Ah, the dreaded unverified breakpoint. We’ve all been there. It’s that hollow gray circle that tells you VS Code can’t connect the line in your editor to the code that’s actually running. It’s a common hiccup, but the fix is usually pretty simple.
For JavaScript and TypeScript, the culprit is almost always a problem with your source maps (
.mapfiles). These files are the bridge between the clean code you wrote and the compiled, minified mess that the runtime executes.
First, double-check that your build process (like Webpack or tsc) is actually generating source maps. Next, look at your launch.json and make sure the outFiles or webRoot properties are pointing to the correct directory where your compiled JS files and their maps live.
If you’re working with a compiled language like C# or C++, the reason is often even simpler: you probably forgot to build your project in Debug mode. A release build strips out the debugging symbols the debugger needs to map everything correctly.
Master VS Code Debugging
Transform bug hunting from guesswork into a precise, efficient process with advanced debugging techniques.
📊 Core Metrics
- Time-to-Resolution — How quickly you can find and fix a bug from the moment it's reported.
- Bug Recurrence Rate — Percentage of fixed bugs that reappear, indicating a shallow fix.
- Environment Parity Bugs — Issues caught only when debugging in remote/containerized environments.
🕹️ My Cheatcodes
- 🌱 Conditional Breakpoints First — For bugs in loops, skip the noise by pausing only when a condition is met.
- 🦎 Logpoints over Console.log — Inject temporary logging without changing or restarting your code.
- ⚡ Launch vs. Attach — Launch to start a new process; attach to one that's already running.
✅ Before Shipping a Fix
- 🔍 Verify source maps are configured correctly in `launch.json`.
- 📊 Remove all temporary Logpoints and non-essential breakpoints.
- 🧭 Confirm the fix works in a production-like environment (e.g., Docker).
- 📈 Add a regression test to prevent the bug from returning.
Gallery
Lemon shots