
Cycle Time Meaning What It Is and How to Improve It
Cycle time is simple on the surface: it’s the time that elapses from when active work starts on a task to when it’s completely done. Think of it as the “hands-on” part of the process. This metric is all about measuring your team’s internal speed and production capability, from the first line of code to the final deployment.
What Cycle Time Really Means for Your Team
Let’s drop the jargon and think about it like this. Imagine you’re at your favorite local coffee shop. Cycle time isn’t the entire time from when you place your order to when you get your coffee. Instead, it’s the focused period that starts the moment the barista picks up your cup and starts grinding the beans, and ends the second they call your name. This is the ‘active work’ phase.
In the software world, this is the time from when a developer drags a ticket into their “In Progress” column until that feature is merged, tested, and shipped to production. It includes every single step along the way—the actual coding, waiting for a code review, testing, and getting it deployed. The whole idea is to measure how long a piece of work takes to move through your team’s internal workflow.
Why This Metric Matters So Much
Getting a handle on your cycle time is about way more than just putting a number on a dashboard. It’s a powerful lens that gives you a clear picture of how healthy and efficient your development process really is. When you track it consistently, it gives you concrete insights you can actually use to get better.
Here’s why it’s so important:
- You’ll Get Way Better at Predicting Timelines: When your cycle time is stable and short, it means your team is shipping work at a consistent clip. This makes it so much easier to forecast deadlines accurately, which builds a ton of trust with stakeholders and the rest of the company.
- You’ll Get Feedback Faster: Shorter cycle times mean new features are in front of actual users sooner. This rapid feedback is the lifeblood of agile development, letting your team pivot and improve the product based on how people are really using it.
- You’ll Spot Bottlenecks Instantly: Is a task always getting stuck in “Code Review” for days on end? A long cycle time will shine a massive spotlight on that bottleneck. It points you directly to the friction in your workflow that’s slowing everything down.
By focusing on cycle time, teams start thinking less about individual busyness and more about the efficiency of the whole system. The goal isn’t to make developers type faster; it’s to create a smooth, predictable flow of value from an idea all the way to a happy customer.
Ultimately, tracking cycle time turns a vague management buzzword into a practical tool the entire team can use for real improvement. It helps you stop guessing where the problems are and start making smart, data-driven decisions that build a healthier and more effective engineering culture.
Cycle Time vs. Lead Time: What’s the Real Difference?
In the world of software development, a few terms get tossed around so often they start to blend together. Cycle time and lead time are a classic pair. They sound alike, and they both measure time, but they tell you completely different stories about your workflow.
Getting this right is more than just semantics—it’s about knowing exactly where to look when you need to fix a problem.
Let’s make it simple. Imagine you order a pizza.
The entire time you spend waiting, from the moment you hang up the phone or click “confirm order” until the delivery person rings your doorbell, is the lead time. It’s the full customer experience, from request to delivery.
Now, cycle time is what happens back at the pizza shop. It kicks in the second the chef starts tossing the dough for your pizza. It stops once the pizza is boxed up and handed off for delivery. Cycle time is purely the “active work” or “hands-on” part of the process.
If you want to dig deeper into the customer-facing side of things, our guide on lead time in software development is a great place to start.
Broadening Your Metrics Toolkit
While cycle time and lead time are the headliners, a couple of other metrics can give you a much richer picture of your team’s performance.
- Takt Time: This one is a little different. It’s not a measurement of what you did, but a calculation of what you need to do. Takt time is the rhythm you must maintain to meet customer demand. Think of it as your target pace, calculated by dividing your available working time by the number of features customers are asking for.
- Throughput: This is the simplest of the bunch. It’s a straightforward count of how many items your team finished in a set period. If you ship 10 features in a month, your throughput is 10. It’s all about output, not the speed of any single task.
This focus on the “active work” phase is what makes cycle time so powerful. When you get a handle on it, you don’t just get faster—you get more predictable, which paves the way for meaningful, sustainable improvements.
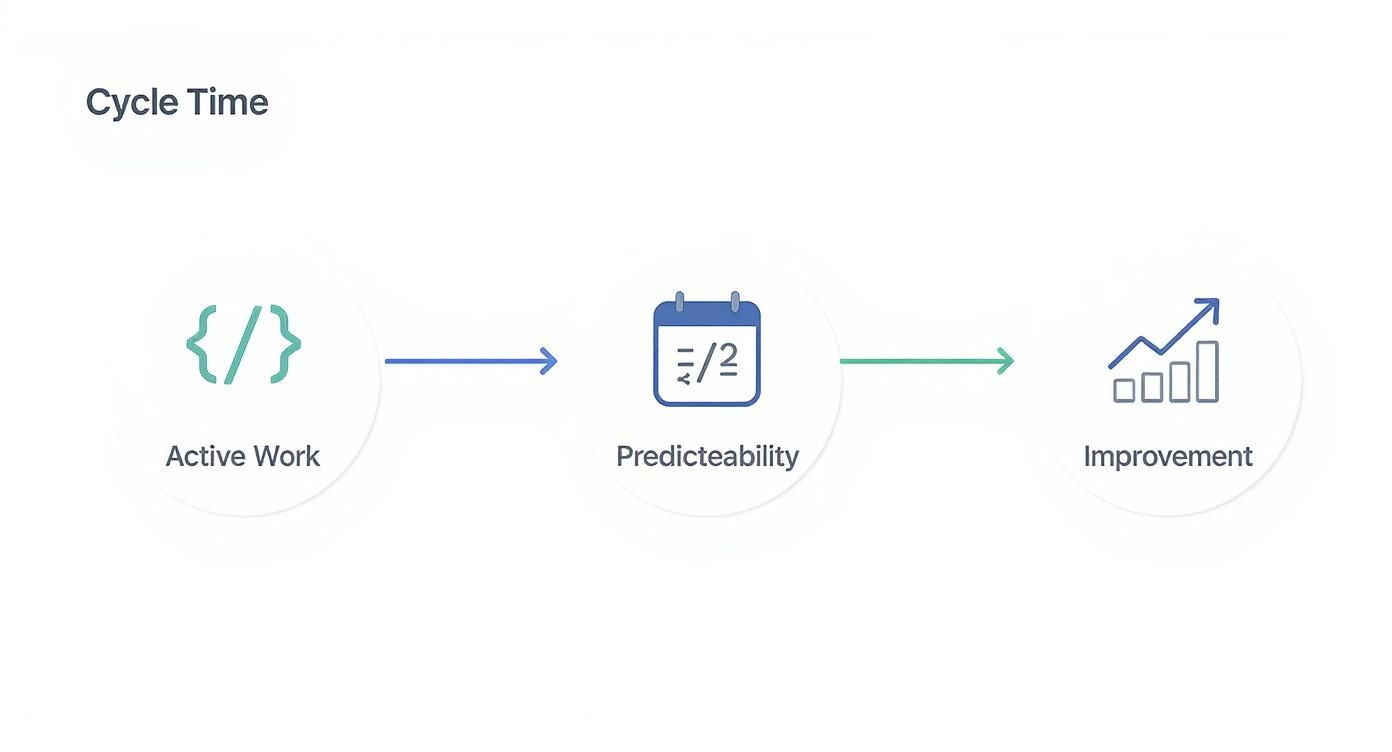
As you can see, mastering cycle time creates a positive feedback loop. A predictable system is one you can actually improve.
A Side-by-Side Comparison
To really nail down the differences, it helps to see these metrics laid out together. While it’s a cornerstone of software engineering today, the idea of cycle time actually comes from manufacturing. There, it measures the time needed to produce one item. For example, if a factory runs for 435 minutes and makes 100 widgets, the cycle time is 4.35 minutes per widget. That same principle of measuring focused production time is just as critical for writing code.
Here’s a quick-reference table to help you keep these key metrics straight.
Cycle Time vs. Lead Time vs. Takt Time vs. Throughput
| Metric | What It Measures | Starts When… | Ends When… | Primary Focus |
|---|---|---|---|---|
| Cycle Time | The time it takes to complete a task once active work has begun. | Work actively begins on a task. | The task is delivered or complete. | Internal team efficiency |
| Lead Time | The total time from a request being made to its final delivery. | A customer makes a request. | The request is delivered. | Customer experience |
| Takt Time | The pace required to meet customer demand. | (Not applicable) | (Not applicable) | Production planning |
| Throughput | The number of tasks completed within a specific time frame. | The beginning of a time period. | The end of a time period. | Team output rate |
Think of this table as your diagnostic tool. If customers are complaining about how long it takes to get a new feature, you have a lead time problem. But if your developers feel like their work is constantly getting stuck in code review or QA, it’s time to dig into your cycle time.
How to Measure Your Team’s Cycle Time Accurately

Knowing what cycle time is is a great first step. But measuring it accurately? That’s where you turn theory into real-world results and start making a tangible difference. This is where the rubber meets the road, moving from an abstract idea to hard data that shows how fast your team is really moving. The good news is, you don’t need a complicated formula to get going.
The absolute first thing you have to do is agree on your start and end points. It sounds almost too simple, but if you’re not consistent here, the data you collect will be basically useless. Your team needs to sit down and decide what “active work” means for your specific process.
The goal is unwavering consistency. Every task, regardless of size or complexity, must be measured using the exact same start and end triggers. This discipline is the foundation of reliable cycle time analysis.
This simple rule ensures you’re always comparing apples to apples. It lets you spot real patterns in your workflow instead of getting distracted by noise from inconsistent tracking.
Defining Your Workflow Stages
To nail down your start and end points, just look at your project management board—think Jira, Trello, or whatever you use. The columns tell the story of your workflow. A common and really effective way to set up your measurement is:
- Start Point: The moment a task moves out of the backlog (like from a “To Do” or “Ready for Dev” column) and into an active state like “In Progress”. This is the signal that a developer has picked it up and started working.
- End Point: The moment the task is truly finished and delivered. For some, this might be when it’s moved to “Done”. For others, it’s when it’s “Merged” or even “Deployed to Production”.
Choosing the right endpoint really depends on what you’re trying to understand. “Done” might be enough if you just want to track coding time, but “Deployed” gives you a more complete picture of the entire delivery process. The crucial part is to pick one definition and stick with it. If you want to dig deeper, you can explore some different methods for calculating cycle times to see what fits your team best.
Capturing Data and Embracing Automation
Once you’ve defined your stages, you have to capture a timestamp every time a ticket moves from your start column to your end column. You could track this manually in a spreadsheet, but let’s be honest—that’s a tedious nightmare and a recipe for human error.
Thankfully, modern tools like Jira and GitHub can do the heavy lifting for you. They already log the history of every status change, so you can pull this data or connect it to analytics tools that specialize in making sense of it.
Cycle time originally came from manufacturing, where automated factories could measure their output in seconds per unit. The principle is exactly the same for software today: accurate measurement means breaking down the process and finding the hidden bottlenecks. This is where a tool like Zest really shines, by automatically pulling all this data together and showing you exactly where things are getting stuck, with zero manual work.
Finding the Hidden Bottlenecks in Your Workflow

Collecting cycle time data is one thing, but the real magic happens when you use it to see the story of your workflow. It’s like being a detective. Those numbers aren’t just numbers; they’re clues that, when visualized, let you stop guessing where the problems are and start seeing them clearly.
One of the best ways to do this is with a simple scatter plot. Each dot on the chart is a single completed task, plotted by how long it took. Before long, you’ll start to see patterns emerge that tell you a lot about the health of your development process.
Interpreting Your Cycle Time Patterns
So, what story is your scatter plot telling you? The way the dots are arranged is your first big clue.
- A Tight Cluster: If most of your dots are huddled together, give yourself a pat on the back. This is a sign of a stable, predictable process. Your team is knocking out work at a consistent pace, which makes forecasting future work and hitting deadlines way easier.
- A Wide Spread: A chart with dots scattered everywhere? That’s a red flag for unpredictability. Some tasks are zipping through the process while others get stuck in limbo for days or even weeks. This kind of variation means you’ve got hidden bottlenecks wreaking havoc on your flow.
It’s important to remember that consistency often matters more than raw speed. An unpredictable workflow with a low average cycle time is usually a bigger problem than a slightly slower process that’s highly predictable. Predictability is where continuous improvement begins.
Segmenting Cycle Time to Pinpoint the Problem
When you see a wide spread of data, your next question should be why. A high overall cycle time just tells you there’s a problem, not where it is. To find the real culprit, you need to break your workflow down into its individual stages.
By segmenting your cycle time, you can measure how long a task spends in each specific phase. For example, you can track the time spent on:
- Active Coding: When a developer is actually writing code.
- Code Review: How long a pull request sits waiting for feedback.
- QA/Testing: The time work spends in the quality assurance process.
- Deployment: The final steps to push code live.
This segmented view can lead to some eye-opening discoveries. You might find that tasks only spend 20% of their cycle time in active development, while the other 80% is spent just waiting in a queue—like for a code review or a handoff to QA. This completely changes the conversation from “we need to code faster” to “we need to unblock the system.” Analyzing these stages helps you build a better understanding of the key engineering performance indicators that truly move the needle.
This is where tools like Zest come in. They automate the whole process, showing you not just the total cycle time but how long each stage takes. It makes it incredibly simple to spot the exact part of your workflow that’s slowing everything down, turning a complicated diagnosis into a clear, actionable insight.
Practical Strategies to Shorten Your Cycle Time
Once you’ve pinpointed where the bottlenecks are in your workflow, it’s time to start clearing them out. Understanding what your cycle time data is telling you is the key to making smart changes—the kind that makes your team more effective, not just busier. The real goal isn’t just raw speed; it’s about creating a smooth, predictable flow of value to your users.
Fortunately, there’s no need to reinvent the wheel here. Engineering teams have already built a solid toolkit of proven techniques for shrinking cycle time and boosting efficiency. Most of these strategies boil down to removing waste, improving focus, and automating the repetitive stuff.
Limit Your Work-In-Progress (WIP)
This might sound backward, but one of the single most effective ways to shorten cycle time is to limit how many things your team works on at once. Isn’t doing less work at the same time going to slow you down? The answer is a hard no.
When developers are constantly juggling multiple tasks, they’re bleeding focus and efficiency through context-switching. By setting a Work-In-Progress (WIP) limit, you create a forcing function for the team: finish what you started before picking up something new. This creates a natural pull system where work moves smoothly from one stage to the next, which drastically cuts down on how long tasks sit around waiting in queues.
Automate Your Testing and Deployment
Manual processes are magnets for delay. Things like running tests, merging code, and deploying to production are not only slow but also ripe for human error. Automating these steps is a total game-changer for your cycle time.
- Continuous Integration (CI): Automatically run your test suite every time code is committed. This finds bugs almost instantly, right at the source, before they can cause bigger problems down the line.
- Continuous Deployment (CD): Once tests pass, the code is automatically deployed to production. This gets rid of the long, manual handoffs where work often sits idle for hours, or even days, waiting for the next person.
By automating your pipeline, you let developers get back to doing what they do best: solving tough problems and building great features. Let the machines handle the repetitive, low-value work.
Foster a Culture of Swift Code Reviews
The code review stage is, more often than not, the single biggest bottleneck in the entire development process. A pull request that sits for days waiting for feedback adds a huge chunk of “wait time” to your cycle time.
The fix is cultural. Make code reviews a top priority for everyone on the team. Set a clear expectation that reviews should be handled within a specific window, like a few hours, not a few days. Encourage small, frequent pull requests—they’re much easier and faster to review than some massive, monolithic change. This doesn’t just speed things up; it actually improves the quality of the feedback.
These optimizations aren’t just theoretical; they have a massive real-world impact. Companies that actively track and reduce their cycle times often boost their operational efficiency by up to 25%. Furthermore, businesses using digital tools for real-time analytics have seen an average cycle time reduction of 12% within 18 months, which translates directly to getting to market faster. You can dig into more data on these cycle time improvements on tulip.co. Each of these strategies, from WIP limits to faster reviews, helps build a more agile and responsive engineering culture.
Common Pitfalls When Tracking Cycle Time
Cycle time is a fantastic diagnostic metric, but it’s a bit like a powerful new tool in the workshop—if you don’t know how to use it right, you can do more harm than good. When teams first start tracking it, they often stumble into a few common traps.
These mistakes can quickly turn a helpful insight into a source of friction and mistrust. The key is to see cycle time for what it is: a tool to help the team get better, not a weapon to pin blame on individuals.
The absolute worst thing you can do is use cycle time to compare developers against each other. It’s the fastest way I’ve seen to torpedo morale and kill psychological safety. As soon as engineers feel like they’re being judged on raw speed, they’ll do what anyone would do: they’ll start gaming the metric.
They’ll cut corners, skip writing tests, skimp on documentation, and avoid the complex refactoring that everyone knows is necessary. It creates a toxic, competitive environment where the goal shifts from building great software to simply looking fast.
Cycle time is a measure of the system, not the individual. Its real purpose is to take the pulse of your workflow, find the bottlenecks, and show you where the whole team can improve together.
Chasing Averages and Ignoring Outliers
Another trap I see teams fall into is getting fixated on the average cycle time. They just want to see that number go down, no matter what. While a downward trend is obviously a good sign, the average can be incredibly deceptive.
Why? Because averages hide the outliers. They smooth over the one or two tasks that took weeks longer than everything else. It’s so tempting to just write these off as “one-offs,” but those outliers are often where the biggest lessons are hiding.
Think about that one feature that got stuck in code review for three weeks. It’s not just an anomaly; it’s a signal. It might be pointing to a fundamental problem in your review process, a knowledge silo on the team, or a painful dependency on another department that’s secretly slowing everyone down.
- Don’t Dismiss Them: Instead of shrugging off an outlier, get curious. Hold a blameless retro to unpack what really happened.
- Find the Root Cause: Was the ticket poorly defined from the start? Did it sit waiting for one specific person’s approval? Was there some hidden technical beast that no one saw coming?
- Learn the Lesson: Treat these frustratingly long tasks as your best teachers. They show you exactly where to focus your efforts to make the whole system more resilient and predictable.
At the end of the day, the goal isn’t just a lower number on a dashboard. It’s about creating a stable, predictable process that helps your team ship value without all the drama. That means focusing on consistency, learning from the exceptions, and always thinking about how to improve the system, not just pressure the people in it.
Got Questions About Cycle Time? We’ve Got Answers.
As teams start digging into cycle time, a few common questions always pop up. Let’s walk through them to clear up any confusion and get you on the right track.
What Is a Good Cycle Time for a Software Team?
Honestly, there’s no magic number. A “good” cycle time for your team isn’t about hitting some industry benchmark; it’s about being stable and predictable.
The first step is just to figure out what your baseline is. The real goal is to shrink the variability in your process. A team that consistently delivers work in a predictable timeframe, even if it’s a bit slower, is far more effective than a team that’s fast but completely chaotic. Once you nail down that consistency, you can start looking for ways to bring the average down without cutting corners on quality.
How Can We Start Measuring Cycle time Without Any Fancy Tools?
You can absolutely get started with the basics. A simple spreadsheet or even a physical Kanban board on a wall will do the trick.
It’s pretty straightforward:
- Define Your Start & End: Decide which column on your board means “Work Has Started” (like ‘In Progress’) and which one means “It’s Shipped” (like ‘Done’ or ‘Deployed’).
- Log the Dates: When a task card moves into your start column, jot down the date. When it hits the end column, write down that date, too.
- Do the Math: The number of days between the start and end date is the cycle time for that one task.
This hands-on method is a fantastic way to really understand your workflow before you bring in a tool like Zest to automate the tracking for you.
Does Cycle Time Include Waiting for Code Review?
Yes, absolutely. Cycle time covers the entire elapsed time from the moment work begins until it’s finished. That includes every minute a task spends just sitting around and waiting.
That time a pull request waits in the “Needs Review” column? That’s a classic “wait state.” In fact, for most teams, the code review queue is one of the biggest bottlenecks they uncover when they first start measuring cycle time. It’s often the single best place to look for quick improvements.
Mastering Your Cycle Time: A Quick Reference
Think of this as your cheat sheet. Use these points to turn cycle time from just another number into a powerful way to make your team’s workflow better every single week.
📊 The Core Metrics to Watch
- Cycle Time Consistency: How predictable are you? Is your delivery timeline stable or all over the place?
- Wait Time Percentage: What slice of the cycle is spent on hold (e.g., waiting in the code review queue)?
- Outlier Rate: How often do tasks take way longer than average to get done?
🕹️ My Pro Tips
- 🌱 System, Not Speed: Use cycle time to find and fix problems in your process. It’s not a tool for ranking developers.
- 🦎 Tame the Chaos First: Before you try to get faster, focus on making your process predictable. Consistency is king.
- ⚡ Learn from the Stragglers: Those tasks that take forever to finish? Dig into them. They hold the biggest clues for how to improve.
📈 Questions for Your Next Retro
- 💡 What’s the biggest “waiting game” in our workflow right now?
- 🧩 When we say a task is ‘Done,’ is that really the end of the line, or are there more steps?
- 📘 Are we using cycle time as a tool to help the team get better, or is it starting to feel like an individual performance report?
Master Your Workflow Velocity
Turn cycle time from just another number into a powerful way to make your team's workflow better every single week.
📊 Core Metrics
- Cycle Time Consistency — How predictable your delivery timeline is (stable vs. erratic).
- Wait Time Percentage — The slice of the cycle spent idle in queues like code review.
- Outlier Frequency — How often tasks take significantly longer than the team average.
🕹️ My Cheatcodes
- 🌱 System, Not Speed — Use cycle time to diagnose the process, not to rank individual developers.
- 🦎 Consistency Over Velocity — Focus on making your workflow predictable before trying to make it faster.
- ⚡ Analyze the Outliers — Dig into the tasks that take forever; they reveal your biggest bottlenecks.
✅ Before Optimizing
- 🔍 Define precise "Start" and "End" points for measurement.
- 📊 Automate data collection to eliminate manual error.
- 🧭 Segment cycle time by workflow stage (e.g., Coding, Review, QA).
- 📈 Establish a baseline before implementing changes.
Gallery
Lemon shots



