
Build a Cycle Time Calculator to Ship Faster

In the world of software development, there’s one metric that truly cuts through the noise: cycle time. It tells you exactly how fast your team turns an idea into a finished product. Think of it as the total time from the moment a developer first picks up a task to the second it’s shipped. A cycle time calculator is the key to unlocking this insight, helping you find those hidden bottlenecks and ultimately deliver more value to your users, faster.
Why Cycle Time Is Your Team’s North Star Metric

With all the complexities of modern projects, teams desperately need a single source of truth to gauge their real-world delivery speed. That’s where cycle time comes in. It’s become one of the most vital software development metrics because it gives you a clear, honest baseline for how efficient your entire process is.
Metrics like velocity or story points can feel a bit abstract, but cycle time is concrete. We’re talking about days and hours—real units of time that give you a tangible feel for your team’s end-to-end delivery health.
The Power of a Clear Focus
When you zero in on cycle time, you start connecting your team’s day-to-day work with bigger business goals. Shaving time off your cycles directly speeds up your time-to-market and boosts your development ROI. The conversation shifts from, “Are we busy?” to “Are we delivering value effectively?”
This kind of clarity is a game-changer for a few reasons:
- It exposes hidden friction. A long cycle time is just a symptom. The real problem might be vague requirements, a bogged-down code review process, or inefficient testing.
- It aligns the whole team. Everyone gets behind a simple, shared goal: shorten the time it takes to get from “in-progress” to “done.” This creates a powerful, unified focus on clearing roadblocks.
- It builds incredible momentum. There’s nothing more motivating than watching your median cycle time drop. It’s hard proof that the improvements you’re making are actually working.
Key Takeaway: Cycle time isn’t just a number; it’s a diagnostic tool. A consistently low and predictable cycle time is the hallmark of a high-performing engineering team that can ship features reliably and quickly.
Connecting Cycle Time to Business Outcomes
Every single day you shave off your cycle time is a day you get feedback from real users sooner. That feedback loop is the true engine of innovation. The faster you can ship, learn, and iterate, the stronger your product becomes.
A cycle time calculator, whether it’s a simple spreadsheet or a more sophisticated tool, is where this journey begins. It turns abstract workflow stages into cold, hard data, letting you see your process with fresh eyes. For a deeper dive into the fundamentals, check out our complete guide on the meaning of cycle time. Next up, we’ll get into the practical steps of building your own calculator.
The Simple Formula for Calculating Cycle Time
At its core, the math behind cycle time is refreshingly simple. You don’t need a degree in statistics to get a handle on it.
Cycle Time = End Date - Start Date
That’s really all there is to it. You’re just subtracting the moment work began from the moment it finished. This gives you the total time a task was actively being worked on.
The real challenge, and where I see teams stumble all the time, isn’t the subtraction. It’s getting everyone to agree on what “Start Date” and “End Date” actually mean for your specific workflow. If you’re not consistent, you’ll get data that looks right but tells you the wrong story.
Defining Your Start and End Points
Before you can build any kind of reliable cycle time calculator, your team has to sit down and agree on these two critical data points. This is a communication problem, not a technical one. Without that alignment, you’re just comparing apples to oranges, and your metrics will be useless.
The trick is to pick triggers that are crystal clear, automatically timestamped by your tools, and genuinely reflect when active work starts and stops.
Let’s look at the usual suspects.
What Counts as a “Start Date”?
The “start” of a task is when a developer actually puts their hands on the keyboard. It’s that moment a task moves from the “maybe later” pile to the “happening now” list.
Here are a few common ways to define it:
- Ticket Moved to “In Progress”: This is my go-to and easily the most common. When someone drags a ticket in Jira, Linear, or Azure DevOps from “To-Do” to “In Progress,” it creates a clean, timestamped event. It’s a deliberate act.
- First Commit Made: For teams that think in terms of code, this is a solid option. The timestamp of the first commit tied to a task is a hard signal that code is officially being written.
- Developer Assignment: I’d steer clear of this one. Assigning a developer often just means it’s now sitting in their personal queue, not that they’ve started working. It’s often an inaccurate starting line.
For most teams, moving a ticket to an “In Progress” status is the most reliable start signal. It’s a conscious decision that says, “I’m picking this up now.”
What Counts as an “End Date”?
Defining the finish line is just as important. Are you measuring when the coding is done, or when the value is delivered? Your answer determines your end point.
- Pull Request Merged: A very popular and practical end point. The merge marks the moment code has passed review and is officially integrated into the main branch. For many engineering teams, this is “done.”
- Code Deployed to Production: This is the “true done.” It extends your cycle time to include the final delivery step, measuring the full journey from the first line of code to the feature being in the hands of users.
- Ticket Moved to “Done”: Like the start date, this relies on a manual status change. It works perfectly, but only if your team has the discipline to move tickets after the work is truly shipped and verified.
Finding Your Data in Common Tools
The good news is you don’t need to be a time-and-motion expert with a stopwatch. Your project management and version control systems are already tracking all of this for you.
You just need to know where to look.
| Tool | Where to Find Start/End Timestamps |
|---|---|
| Jira | Head to the History or Activity tab on any issue. You’ll see the exact timestamp for every status change, including when it moved from “To Do” to “In Progress.” |
| GitHub / GitLab | Check the timestamp on the first commit in a pull request for a start time and the merge timestamp for an end time. These are hard, auditable data points. |
| Linear | Linear’s issue history is incredibly clean. It clearly shows when a task moved into your team’s “in progress” state and when it was marked as completed. |
Once you’ve established clear definitions and know where to pull the data, you’ve done the hardest part. You’re ready to start gathering these inputs and build your first cycle time calculator. For a deeper dive with more concrete examples, you might find our guide on how to calculate cycle time helpful.
How to Build Your First Cycle Time Calculator
You don’t need fancy, expensive software to start tracking cycle time. Honestly, you can build an incredibly powerful cycle time calculator with something you already have: a simple spreadsheet. I always recommend teams start here—it’s fast, free, and forces you to really understand your own workflow.
The goal isn’t just to crunch numbers. It’s to build a tool from scratch, in under an hour, that immediately starts telling you the story of your team’s delivery speed.
This is the core idea—it’s all about capturing a start time and an end time to find the total duration. Simple, right? But incredibly powerful.
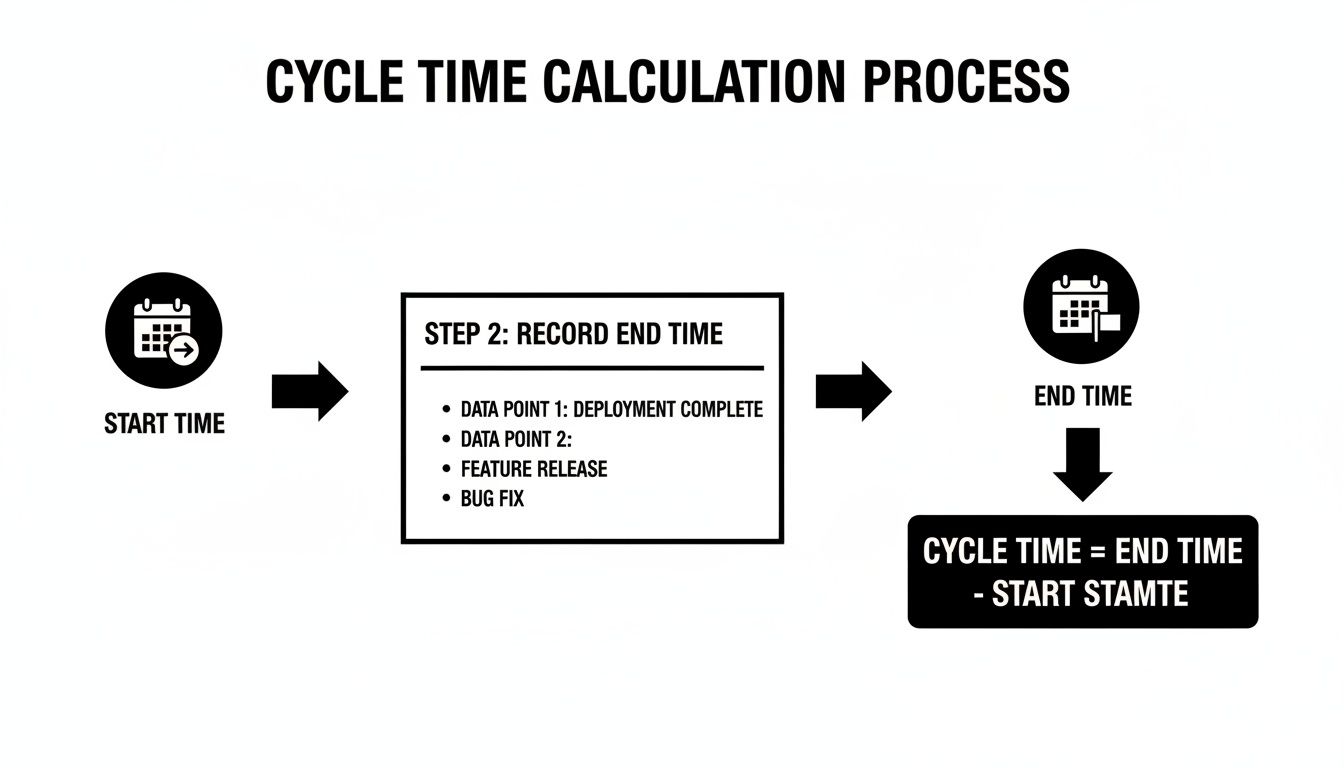
Everything boils down to accurately recording these two timestamps for every single task that your team works on.
Setting Up Your Spreadsheet
Let’s get practical. Open up a new Google Sheet or Excel file and lay down the foundation. You only need a few columns to get started.
Here’s the basic setup I use:
- Task ID: A unique ticket number, like JIRA-123 or GH-456.
- Task Type: A category to help you spot trends. Is it a Feature, a Bug, or maybe a Chore?
- Start Timestamp: The moment work actually began. Be specific.
- End Timestamp: The moment the task was considered “done.”
- Cycle Time (Days): This is where the magic happens. We’ll automate this with a formula.
This simple structure is more than enough to start logging data. The most important part? Get your team to agree on what “start” and “end” actually mean. Consistency is everything.
The Core Calculation Formula
Okay, time for the fun part. In your “Cycle Time (Days)” column, you’re just going to subtract the start date from the end date. Let’s say your End Timestamp is in column D and your Start Timestamp is in column C.
In cell E2, type this simple formula:
=D2-C2
Now, just click and drag that formula all the way down the column. As you add new tasks and their timestamps, the cycle time will pop in automatically. This gives you the raw duration in days.
Pro Tip: Make sure your timestamp columns are actually formatted as dates (e.g.,
MM/DD/YYYY HH:MM). This is the #1 reason I see this calculation fail. If the format is wrong, the spreadsheet won’t know how to do the math.
Handling Real-World Scenarios
A basic calculator is a great first step, but real work is messy. People don’t work on weekends. Holidays pop up. A truly useful calculator needs to account for how work actually happens.
Here are a couple of ways to level up your spreadsheet.
Excluding Weekends from Your Calculation
You almost certainly want to ignore weekends. After all, a task started on a Friday and finished on Monday didn’t take three full days of effort. The NETWORKDAYS function is your best friend here. It cleverly counts only the business days between two dates.
Just switch out your old formula in the “Cycle Time (Days)” column for this one:
=NETWORKDAYS(C2, D2)
This instantly gives you a more realistic picture of the actual time spent on a task, filtering out the weekend noise.
Measuring Cycle Time in Hours
For teams on a really fast cadence, measuring in days can feel too broad. Sometimes you need to see the hours.
To do this, you can stick with the original formula (=D2-C2), but change how the cell is formatted. In Google Sheets, you can go to Format > Number > Duration. This will display the result in a much more granular HH:MM:SS format, which is perfect for digging into smaller tasks and spotting quick bottlenecks.
As you get more comfortable, you can build even more specialized tools for optimizing your processes, much like you would build a custom Workflow Automation Calculator.
By starting with this simple spreadsheet, you’re creating a single source of truth. You’re moving from guessing how long things take to knowing, with cold, hard data to back it up.
How to Read Your Cycle Time Data
Collecting the data is the easy part. Now for the real work: turning those numbers from your cycle time calculator into a story about your team’s workflow. Raw data is just noise until you figure out how to interpret it. This is where you graduate from being a time-tracker to a genuine process-improver, finding the hidden friction that’s slowing everyone down.
Think of the numbers you’ve gathered as clues. They point to where your process is flowing smoothly and, more importantly, where it’s getting jammed. Learning to read these signals is the key to making meaningful, data-driven improvements that actually speed up delivery.
Average vs. Median: Why It Matters
When you first look at your cycle times, your gut reaction will be to calculate the average. It feels right, but it can be incredibly misleading. Why? Because an average is easily thrown off by outliers—those one or two massive tasks that took weeks longer than everything else.
Imagine your team knocked out five tasks with these cycle times: 3, 4, 5, 4, and 28 days.
- The average cycle time comes out to 8.8 days. That number paints a picture of a team that’s much slower than it really is, all thanks to that one outlier.
- But the median cycle time (the middle value when you line them up) is just 4 days. This gives you a much more honest and realistic view of a typical task’s journey.
Key Insight: Always prioritize the median over the average. The median tells you what is typical, while the average gets skewed by the exceptions. Focusing on the median helps you understand the experience of most of your work, not the outliers.
Spotting Bottlenecks with Trend Analysis
Your cycle time data becomes truly powerful when you look at it over time. A single number is just a snapshot; a trend tells the full story. Are your cycle times slowly creeping up? Are they stable and predictable? Or are they all over the place, swinging wildly from week to week?
This is where you start hunting for bottlenecks. By breaking down cycle time into its different stages (like In Progress, Code Review, or QA), you can see exactly where tasks are spending the most time.
- Long “In Progress” times? This often points to fuzzy requirements, technical debt, or tasks that are simply too big to begin with.
- Tasks stuck in “Code Review”? A classic bottleneck. It could mean your team needs clearer review guidelines, or you just don’t have enough developers available to review pull requests.
- Delays in “QA”? Your testing environment might be flaky, or the handoff between developers and QA is clunky and inefficient.
The global software development market has exploded, making cycle time optimization a huge focus for getting a return on those massive investments. As IT spending keeps climbing, companies are pouring money into tools and practices that shrink cycle time and boost delivery speed. You can find more on these trends and software development statistics on ManekTech.com.
Visualizing Your Data with a Scatter Plot
One of the best ways to get a quick read on your process health is with a Cycle Time Scatter Plot. This chart plots every completed task as a single dot, showing its completion date on the horizontal axis and its cycle time on the vertical axis.
This kind of visualization makes patterns jump out almost instantly:
- Clusters of dots show you what’s typical. A tight, low cluster is a great sign of a healthy, predictable process.
- Dots scattered way up high are your outliers. If you’re seeing a lot of these, it could mean your process is unstable.
- A trend line that’s creeping upwards is a clear warning sign that things are slowing down over time.
A scatter plot transforms your spreadsheet from a wall of numbers into a powerful diagnostic tool. It helps you talk about process health with your team and stakeholders in a way a single number never could. It’s the first step toward building a shared understanding of where you can actually improve.
Decoding Your Cycle Time Results
Once you’ve got the data, the next step is to translate it into action. The numbers tell a story, and learning to read that story is what separates good teams from great ones. This table can help you diagnose what you’re seeing and decide what to do next.
| If You See This | It Could Mean | Your Next Action |
|---|---|---|
| High Median Cycle Time | The entire process is slow; tasks consistently take a long time. | Map your value stream to find the biggest system-wide delay. |
| Wide Variability (scattered dots) | Your process is unpredictable and lacks consistency. | Standardize your workflow, create checklists, and improve task definitions. |
| Long Code Review Stage | Not enough reviewers, complex code, or unclear pull requests. | Set up a rotation for code reviews; create PR templates. |
| Many Outliers | Some tasks are much larger or more complex than others. | Improve your task breakdown process; split large stories into smaller ones. |
| A Rising Trend Over Time | You’re taking on technical debt, or team capacity is strained. | Schedule time for refactoring; review team workload and priorities. |
Ultimately, these patterns aren’t just data points—they’re opportunities. Each one is a chance to have a conversation with your team and find a small, concrete way to make your workflow a little bit smoother.
Moving from Manual Spreadsheets to Automated Insights
Your spreadsheet calculator is a fantastic starting point. It’s a tangible, no-cost way to get a handle on your team’s workflow and turn those gut feelings about speed into hard numbers. But as you’ve probably figured out, manual tracking has its ceiling.
The whole process is tedious and, frankly, prone to human error. One forgotten timestamp or a simple copy-paste mistake can throw your data off, sending you on a wild goose chase to solve problems that don’t even exist. More importantly, spreadsheets are reactive. They tell you what happened last week, not what’s happening right now. To make smart decisions on the fly, you need real-time data, and that’s where automation comes in.
The Leap to Automated Cycle Time Tracking
The next logical step in your efficiency journey is moving from a static cycle time calculator to a dynamic, automated system. This is less about just tracking metrics and more about actively optimizing your entire development process from start to finish.
Platforms like Zest are built specifically to get rid of that manual grind. They plug directly into the tools your team already lives in—like Jira, GitHub, and your code editor—to capture every single event automatically. No one has to remember to update a spreadsheet; the data just flows in, creating a single source of truth that is always current.
This automated approach gives you a few major wins over manual tracking:
- Real-Time Visibility: You can spot bottlenecks as they’re forming, not days later when you finally get around to updating your sheet. This means you can step in and fix things immediately.
- Effortless Accuracy: By pulling data directly from the source, you eliminate manual entry mistakes for good. The timestamps are precise and completely trustworthy.
- Deeper Context: Automated tools do more than just capture start and end dates. They can track the time spent in specific stages, like “Code Review” or “QA,” giving you a much clearer picture of what’s really going on.
As you prepare to move beyond simple spreadsheets, it’s helpful to understand the fundamental differences between databases vs spreadsheets to know when and how to scale your data infrastructure.
From Data Collection to Intelligent Workflows
True optimization isn’t just about having faster dashboards; it’s about using that data to build smarter workflows. Once your cycle time tracking is on autopilot, it becomes the engine for a whole range of powerful improvements a spreadsheet could never dream of supporting. This is where you connect the dots between measurement and real action.
For instance, automated insights can fuel things like:
- AI-Powered Standups: Instead of team members trying to remember what they did yesterday, a system like Zest can generate automatic summaries of wins, blockers, and progress based on actual activity. This makes daily check-ins quicker and way more focused.
- Proactive Blocker Detection: An automated system can flag tasks that have been stuck in one stage for too long. Imagine getting an alert when a pull request has been sitting in review for over 24 hours.
- Sharing Winning Strategies: By analyzing the data, you can spot the patterns behind your team’s fastest work. This lets you bottle up those effective strategies—what we call cheatcodes—and share them across the whole organization.
By automating data collection, you free up your team’s time and mental energy to focus on what truly matters: analyzing the insights and making changes that shorten delivery cycles and increase throughput.
Ultimately, moving beyond a manual cycle time calculator is about creating a continuous feedback loop. The system gathers data, presents insights, and empowers your team to act on them right away. If you’re looking for more ways to automate and improve your development process, exploring different types of lead time software can provide valuable perspectives. This evolution turns metric tracking from a chore into a core driver of your team’s continuous improvement.
Common Questions About Cycle Time
Once teams start digging into cycle time, a few key questions always pop up. Getting these straight is the difference between having a new number to track and actually making your workflow better. Let’s run through the most common ones I hear.
What Is the Difference Between Cycle Time and Lead Time?
This is, without a doubt, the most frequent question. And the distinction is critical.
Lead time is the whole enchilada. It starts the second a customer makes a request or an idea hits the backlog and ends only when that feature is live in their hands. Think of it as the complete customer-facing timeline.
Cycle time, on the other hand, is a specific slice of that journey. It tracks the “hands-on keyboard” time—from the moment a developer pulls a ticket into progress until that work is finished and deployed.
Here’s a simple way to think about it: Lead time is the entire marathon, from the day a runner signs up for the race until they cross the finish line. Cycle time is just the time they were actually running on the course. You need both, but cycle time tells you exactly how fast your team can execute.
What Is a Good Cycle Time for a Software Team?
Honestly, there’s no magic number. A “good” cycle time depends entirely on your team, your product’s complexity, and your tech stack. A team wrestling with a decade-old legacy system is going to have a very different baseline than a team spinning up a new microservice.
Forget trying to hit some arbitrary number you read about online. The real goal is to find your team’s own median cycle time and then work to see it consistently trend downward. Focus on your own improvement. A healthy process is one that’s stable, predictable, and always getting just a little bit faster.
What Are the First Steps to Reduce My Team’s Cycle Time?
Don’t try to fix everything at once. The most powerful first step is to find your single biggest bottleneck. Use the data from your calculator to see which stage of your process takes the longest, and start there.
A few usual suspects I often see are:
- Massive tasks: If your “In Progress” time is dragging on, it’s a good bet your stories are too big. Make it a team rule to break epics into smaller chunks that can be knocked out in just a few days.
- Code review gridlock: Are pull requests gathering dust for days? This is a huge, and common, delay. Set a clear team expectation for review turnaround (like within 24 hours) or try a rotation system to spread the load.
- Manual testing delays: If QA is constantly a bottleneck, it’s time to invest in automation. Building out your test suite cuts down on manual work and gives developers much faster feedback.
Does This Work for Both Scrum and Kanban Teams?
Yes, absolutely. The core idea of measuring “work started” to “work done” is universal—it doesn’t care what framework you use.
- In Kanban, it’s a perfect fit. Cycle time is simply how long a card takes to travel from your first “Doing” column to your final “Done” column.
- In Scrum, you can track the cycle time for individual stories within a sprint. This is fantastic for spotting hidden delays inside your sprint process, helping you make each sprint more predictable.
At the end of the day, it’s all about the flow of value, not the specific ceremonies you follow.
Master Your Cycle Time
Use this scorecard to transform raw data into actionable insights for a faster, more predictable workflow.
📊 Core Metrics
- Median Cycle Time — The true, typical delivery speed, filtering out the noise from outliers.
- Time-in-Stage Duration — Pinpoints exactly where work gets stuck (e.g., Code Review, QA).
- Process Predictability — Measures the variability or scatter in your completion times.
🕹️ My Cheatcodes
- 🌱 Define Your Timestamps — Get team-wide agreement on what "Start" and "End" mean.
- 🦎 Prioritize the Median — Focus on the typical workflow experience, not averages skewed by exceptions.
- ⚡ Isolate the Bottleneck — Find the single longest stage in your process and attack it first.
📈 Reflection Points
- 💡 What story does our biggest outlier task tell about our process?
- 🧩 Is our definition of "Done" consistent across the entire team?
- 📘 Are our tasks small enough to flow smoothly through the system?
Gallery
Lemon shots



