Mastering Cycle Time Calculations to Ship Code Faster

Cycle time is simply the clock on the wall. It’s the total time that passes from the moment a developer starts working on a task to the second it’s live in production. Think of it as the true measure of your team’s delivery speed—the actual time it takes to get a piece of work from “I’m starting” to “it’s done.”
This single number gives you a powerful, unfiltered look at your development velocity and the overall health of your process.
Why Cycle Time Calculations Matter
In today’s world, understanding the rhythm of your development process isn’t just a nice-to-have; it’s essential for staying competitive. Cycle time is that rhythm. It cuts through gut feelings and subjective guesses to give you a hard, data-driven look at how quickly your team delivers value.
When you start tracking cycle time, you’re not just timing tasks. You’re building a powerful feedback loop that fuels continuous improvement.
Top-tier teams rely on this metric to build a delivery process that’s both stable and predictable. When your cycle times are consistently low, forecasting becomes much more reliable. This builds immense trust with stakeholders and helps everyone manage expectations. On the other hand, if your cycle times are long or all over the place, it’s a flashing red light signaling deeper problems in your workflow.
Pinpointing Your Real Bottlenecks
One of the best things about tracking cycle time is its uncanny ability to expose hidden friction in your process. It finally gives you concrete answers to those nagging questions every engineering leader has:
- Where is work really getting stuck?
- Are our code reviews the black hole we think they are?
- How much time is just dead time, with tasks waiting for QA or deployment?
Here’s a classic example I’ve seen time and again: a team discovers that the actual “coding time” for a feature is only two days. The real problem? That same feature then sits in a review queue for another five days. That single insight changes the conversation completely. The team’s focus shifts from “code faster” to fixing the review process—and that’s where you find the biggest wins.
To get a fuller picture of what this metric represents, you can dive into our guide on the cycle time meaning for software teams.
Before we go further, it’s helpful to see how this total time breaks down. Different teams have slightly different stages, but the core phases are often the same. Understanding where time is spent in each one is the first step to identifying those pesky bottlenecks.
Breaking Down the Key Stages of Cycle Time
| Phase | Description | Common Bottlenecks |
|---|---|---|
| Active Development | The time a developer spends writing code for a specific task, from the first commit to when it’s ready for review. | Unclear requirements, technical debt, environment setup issues, context switching. |
| Review & Rework | The period when code is under review by peers, including any back-and-forth for feedback and subsequent changes. | Reviewer unavailability, large pull requests, lack of clear review guidelines. |
| QA & Testing | The time dedicated to quality assurance, where the feature is tested for bugs, performance, and functionality. | Lack of automated tests, flaky test environments, slow manual testing processes. |
| Deployment | The final stage of getting the code from a merged state into the hands of users in the production environment. | Complex release processes, insufficient CI/CD automation, release freezes. |
By measuring the time spent in each of these buckets, you can quickly see if, for example, your Review & Rework phase is taking up 60% of your total cycle time. That’s a clear signal on where to focus your improvement efforts.
Fostering a Culture of Improvement
Recent data paints a stark picture: developers spend a mere 43% of their time actually coding. The rest gets eaten up by other activities that bloat cycle time—things like digging for documentation, wrestling with broken builds, or sitting in unnecessary meetings.
When you make cycle time a visible, shared metric, you give your team the data they need to start solving these problems together. Just as tracking cycle time is vital for operational health, leveraging tools for broader business visibility, such as exploring AI brand tracking for SaaS companies, is key for market success. This shift toward improving flow empowers your engineers, helps reduce burnout, and makes sure that every process change you make is backed by real data, not just anecdotes.
Gathering the Right Data for Accurate Calculations
Your cycle time metrics are only as good as the data you feed them. If your data is messy or inconsistent, you’ll get misleading numbers. This can send your team on a wild goose chase, trying to fix problems that don’t actually exist while the real bottlenecks go unnoticed. So, before you calculate anything, your first job is to build a trustworthy data foundation.
This isn’t about just looking at one tool. You need to pull information from the entire ecosystem where your team’s work actually happens. The goal is to piece together a complete picture of a task’s journey, from the very first line of code to its final deployment.
Defining Unambiguous Start and End Points
The most critical part of this whole process? Getting your team to agree on what “start” and “end” actually mean. If there’s any ambiguity here, you can kiss the integrity of your metrics goodbye before you even start.
Does “work started” mean the second a ticket gets dragged into the ‘In Progress’ column in Jira? Or is it when the first commit for that ticket hits your Git repo?
Honestly, there isn’t a single right answer. What matters is that your team picks a definition and sticks to it religiously. Consistency is everything.
A common, and pretty effective, approach is to tie your start and end points to specific workflow events:
- Start Point: The timestamp when a work item moves from a ‘To-Do’ or ‘Ready for Dev’ status into an ‘In Progress’ state.
- End Point: The timestamp when the code for that item is successfully deployed to production and is live for your users.
This visual shows the basic flow, capturing the time from when work actively begins to when it’s considered completely finished.
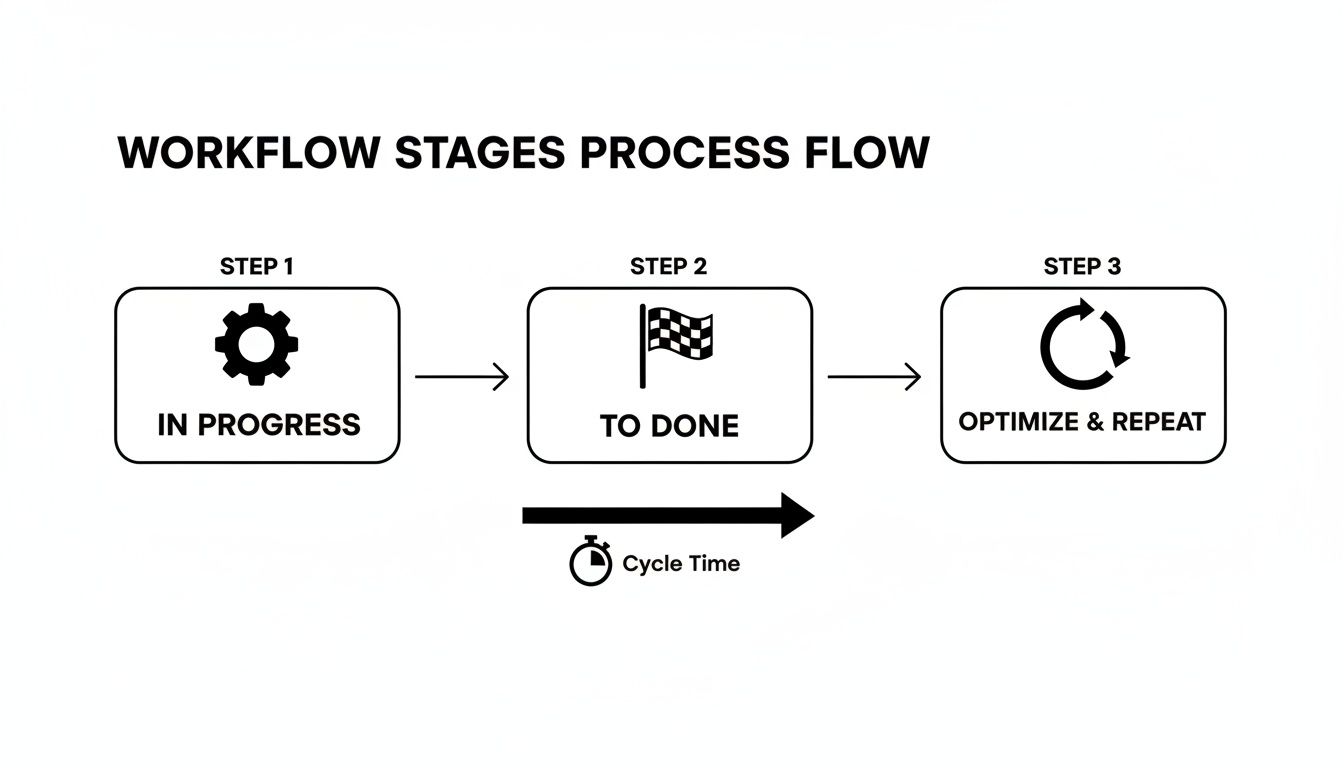
The key takeaway is that cycle time should measure the entire active work period. This includes all the little handoffs and wait times that happen between your start and end markers.
Sourcing Data from Your Existing Toolchain
Once you’ve locked in your definitions, it’s time to tap into the systems that hold all this valuable data. Most engineering teams are sitting on a goldmine of information scattered across their development tools. The real challenge is connecting the dots between these different sources to tell a single, coherent story.
You’ll primarily be pulling from three places:
-
Issue Tracking Systems (e.g., Jira, Asana, Linear): This is your main source for workflow states. You’ll need the timestamps for every status change to map out how long a ticket sat in each phase—from ‘In Progress’ to ‘Code Review,’ ‘QA,’ and ‘Ready for Deployment.’
-
Version Control Systems (VCS) (e.g., Git via GitHub, GitLab): Your VCS gives you critical context that the issue tracker often misses. Timestamps from commits, pull requests, and merges can pinpoint the exact moment coding began, when a review was requested, and when changes were finally integrated.
-
CI/CD Pipeline Logs (e.g., Jenkins, CircleCI): These logs are the final piece of the puzzle. They provide the precise timestamps for when a build started, passed all its tests, and—most importantly—was successfully deployed to production. This gives you that definitive “end” for your cycle time.
The Missing Piece: AI Coding Logs
Traditional tools give you a good high-level view, but they often treat the ‘In Progress’ phase like a black box. A ticket might sit in that column for days, but was the developer actively coding, stuck debugging, or just juggling five other tasks? You’d never know.
This is where modern tooling can add a much-needed layer of detail.
By analyzing logs from AI coding assistants, you can get a high-fidelity record of the active coding phase. This data can show you patterns in how developers engineer prompts, how much time they spend refining AI suggestions, and where they’re hitting friction—things that were totally invisible before.
For instance, a tool like Zest can automatically capture and make sense of these AI session logs. This lets teams see not just that a developer was working, but how they were working. You can start answering deeper questions, like whether a new AI tool is actually making people faster or if they’re spending more time fighting with prompts than writing code. This level of detail turns your cycle time calculation from a simple “how long?” metric into a powerful diagnostic tool.
Applying the Core Formulas for Cycle Time
Alright, once your data is clean and ready, it’s time for the fun part: the actual calculations. This is where you turn all those raw timestamps from Jira, GitHub, or wherever else into a clear picture of how fast your team is really moving. It’s a game-changer, moving you from gut feelings about speed to hard numbers.

The core formula itself is surprisingly straightforward. For any single ticket or work item, it’s simply:
Cycle Time = End Date - Start Date + 1
Why the “+1”? It’s a common practice to make sure a task that starts and finishes on the same day counts as one day of work, not zero. This simple bit of math gives you a single, powerful number: the total calendar days that item spent actively in your workflow.
Breaking Down Stage-Level Cycle Times
The total cycle time is a great starting point, but the real magic happens when you break it down by stage. This is how you find the hidden bottlenecks that are slowing you down. To do this, you just apply the same basic formula to each phase of your process.
Let’s imagine a feature ticket, “FT-123,” and follow its journey:
- Moved to ‘In Progress’: March 4th, 9:00 AM
- Moved to ‘Code Review’: March 7th, 5:00 PM
- Moved to ‘QA Testing’: March 11th, 10:00 AM
- Moved to ‘Done’ (Deployed): March 13th, 4:00 PM
With these timestamps, we can calculate the time spent in each phase.
- Active Development Time: March 7th - March 4th = 4 days
- Code Review Time: March 11th - March 7th = 5 days
- QA Time: March 13th - March 11th = 3 days
Just like that, a story starts to form. This ticket spent more time waiting for code review than it did in active development. That’s a specific, data-driven observation you can bring to your next team meeting—way more effective than just saying “code reviews feel slow.”
Moving Beyond Simple Averages
Calculating the cycle time for one ticket is interesting, but the real power comes from looking at the data in aggregate. This is where you can start to understand the predictability of your entire system. But be careful—just calculating a simple average can lead you astray.
Averages are easily skewed by outliers. A single ticket that gets stuck for 30 days can dramatically inflate your average cycle time, making your process look less efficient than it actually is. Relying solely on the average gives you an incomplete and often inaccurate picture.
To get a more reliable view, you need to bring in medians and percentiles.
- Average (Mean): The sum of all cycle times divided by the number of tickets. It’s a decent starting point but very sensitive to those extreme high or low values.
- Median: The middle value in your dataset. If you lined up all your cycle times from shortest to longest, the median is the number smack in the middle. This means 50% of your work is completed faster than the median, making it a much better indicator of your typical performance.
- Percentiles: This is where you can truly start forecasting. The 85th percentile, for instance, tells you the maximum time it takes to complete 85% of your work. This is gold when you need to give stakeholders a confident delivery estimate. You can say, “Based on our history, we complete 85% of features like this in 12 days or less.”
For example, an 85th percentile of 12 days gives you a much more trustworthy forecast than a simple average of 7 days, which might be hiding a ton of variability. This is how you shift the conversation from “how fast can we go?” to “how predictably can we deliver?”—a much more mature and valuable discussion.
How to Handle Common Calculation Pitfalls
Real-world development is never a straight line, and your cycle time calculations need to reflect that messy reality. A clean formula works great for a ticket that flows perfectly from start to finish, but let’s be honest—that rarely happens. If you ignore the common edge cases, your metrics get warped, and you end up chasing the wrong problems.
To get a trustworthy picture of your team’s velocity, you need a solid game plan for the curveballs that development throws at you every single day.
Managing Blocked and On-Hold Tickets
What do you do when a task grinds to a halt? Maybe you’re waiting on an external dependency or there’s a sudden shift in priorities. If you just let the clock run on a blocked ticket, it can seriously inflate your cycle time and make your process look less efficient than it actually is.
The best practice here is to move these tickets into a dedicated “Blocked” or “On Hold” status in your issue tracker like Jira or Linear. This effectively pauses the cycle time clock. When the blocker is resolved and work starts up again, the ticket moves back into an active state, and the clock resumes.
This simple move gives you two huge wins:
- It stops outliers from skewing your overall cycle time average.
- It creates a new, incredibly valuable metric: Total Time Blocked. Analyzing this data can uncover systemic bottlenecks, like recurring problems with a third-party API or constant delays waiting for design assets.
The Problem of Bouncing Tickets
Another classic issue is the “bounce-back”—a ticket that goes from ‘In Review’ back to ‘In Progress’, or from ‘QA’ back to ‘In Review’. This is a totally normal part of development, but it can wreak havoc on simple stage-level calculations if you’re not careful.
Instead of just measuring the first time a ticket enters a stage, your system needs to calculate the cumulative time spent in each status. For example, if a ticket spends two days in QA, gets kicked back to development, and then spends another day in QA, the total QA time is three days, not one or two.
Measuring this way is far more accurate. It shines a light on areas with high rework, which is often a symptom of unclear requirements, shaky testing, or a breakdown in communication.
Your cycle time calculations should reflect the total effort and duration required to get a task to ‘Done,’ including all the back-and-forth. Ignoring rework hides the true cost of quality issues and process friction.
The Weekends and After-Hours Dilemma
Should your cycle time clock run 24/7, or should it only count business hours? There are strong arguments for both, and the right answer really depends on what you’re trying to measure.
-
Calendar Days (24/7): This measures the total elapsed time from start to finish, no matter when the work happened. This is a reflection of the customer’s experience—they don’t care if a delay happened over a weekend; they just know their feature took five days to arrive. This is usually the best choice for measuring overall delivery speed and predictability.
-
Business Hours/Days: This method only counts the time during your team’s defined working hours. It’s much better for measuring pure process efficiency and understanding how much active effort a task required. This is helpful for internal process improvements but can hide the impact of long wait times that happen overnight or on weekends.
For most teams, starting with calendar days gives a more holistic and customer-centric view. It forces you to confront the real-world delays, not just the time people were actively typing.
Don’t forget that external factors can be a huge part of these delays. Security and talent gaps are now top challenges inflating cycle time, with 51% of tech leaders citing security as the main blocker. Digging deeper, analyses show that machine wait times (42%), flaky tests (41%), and people dependencies (38%) are also significant cycle time killers. You can read more about how these software development statistics impact timelines and get a broader perspective.
Visualizing and Acting on Your Cycle Time Data
Raw numbers and timestamps are just the beginning. To truly understand what’s happening in your workflow and make smart improvements, you have to bring that data to life. This is where visualization comes in—it turns a sterile spreadsheet into a story that immediately highlights bottlenecks, outliers, and progress.

When you put the data on a screen for everyone to see, the conversation shifts. Instead of pointing fingers, the team starts looking at the system itself. A good dashboard doesn’t assign blame; it sparks curiosity and gets everyone asking, “How can we make things flow better?”
This kind of visibility is more important than ever. Think about it: a recent survey found that for a staggering 40% of developers, it takes one to two weeks to get a code idea into the hands of a customer. That’s a lot of time spent in limbo, and visualizations are the fastest way to see exactly where those delays are happening.
Choosing the Right Chart for Cycle Time Analysis
Not all charts are created equal, and picking the right one is key to getting clear answers. A simple bar chart showing averages might hide the fact that your delivery times are all over the place. To get real, actionable insights, you need to match the chart to the question you’re asking.
Here’s a quick guide to the most common charts we use for cycle time analysis and what they’re uniquely good at showing.
Choosing the Right Chart for Cycle Time Analysis
| Chart Type | What It Shows | Best For Identifying |
|---|---|---|
| Cycle Time Scatter Plot | Plots the cycle time for every individual work item completed over a period. Each dot represents a finished task. | Outliers and trends. It makes it painfully obvious which tasks took way longer than average and whether your overall cycle time is creeping up or improving. |
| Control Chart | A scatter plot with an average line and upper/lower control limits (usually set at the 85th or 95th percentile). | Process stability and predictability. This chart tells you if your process is consistent or chaotic. Anything above the upper control limit is a statistical anomaly worth digging into. |
| Cumulative Flow Diagram (CFD) | A stacked area chart showing the number of tasks in each workflow stage over time. The width of each band represents the work in that stage. | Queues and bottlenecks. If the “Code Review” or “QA” band on your CFD is getting wider over time, that’s a crystal-clear sign that work is piling up in that stage. |
These visuals make it easy to spot patterns you’d never find by looking at raw data alone.
From Insights to Actionable Improvements
Once you have these charts, the data starts talking to you. That scatter plot might reveal that every task touching a specific legacy service takes three times longer than anything else. Your cumulative flow diagram might show the “In Review” band swelling every Thursday and Friday, pointing to a pre-weekend bottleneck.
These aren’t just interesting tidbits; they are direct calls to action.
The whole point of visualizing cycle time isn’t to make pretty charts. It’s to generate hypotheses you can test. A chart tells you where the problem is; your team’s job is to figure out why and experiment with a solution.
For instance, seeing that review bottleneck on your CFD could lead the team to try something new, like blocking out specific “focus hours” for code reviews. After you make the change, you keep watching the CFD. Does the “In Review” band start to shrink? This creates a fantastic, data-driven feedback loop for continuous improvement.
Of course, having the data is one thing; putting a solid plan into motion through effective software project management is what turns these insights into faster delivery. It’s also helpful to see how cycle time fits with other metrics; our article on lead time in software development offers a great comparison.
By visualizing your cycle time, you make the invisible work visible. You turn abstract numbers into a shared reality the whole team can get behind and improve together.
Common Questions About Calculating Cycle Time
Even when you have the formulas down, a few practical questions always pop up when teams first start digging into their cycle time. Getting these fundamentals right from the start is crucial for building trust in the metrics and making sure everyone is on the same page. Let’s tackle some of the most common ones I hear.
What Is the Difference Between Cycle Time and Lead Time?
This is, without a doubt, the number one point of confusion. The simplest way I’ve found to explain it is this: Lead Time is the customer’s clock, and Cycle Time is your team’s clock.
- Lead Time starts the second a request is officially made—like when a customer reports a bug or a new feature idea lands in the backlog. It measures the entire journey from that initial idea to the moment it’s live in production.
- Cycle Time, on the other hand, is a subset of that. It only kicks in when a developer actively pulls the task and starts working on it (think moving a ticket to ‘In Progress’). It measures how long it takes your team to actually build, test, and ship the work.
In short, lead time includes all that upfront waiting time in the backlog. Cycle time zeroes in on the active development process itself.
What Is a Good Cycle Time for a Software Team?
Honestly, there’s no magic number. A “good” cycle time is completely dependent on your team’s reality—the complexity of your product, how often you release, and even the industry you’re in. An elite DevOps team pushing code multiple times a day might have a cycle time measured in hours. A team building a complex, highly-regulated system might have a cycle time of several days, and that could be perfectly healthy for them.
The goal isn’t to chase some universal benchmark someone on the internet told you to hit. It’s about establishing your own baseline and then working to consistently shorten and stabilize it over time. Focus on improving your team’s trend, not comparing your numbers to someone else’s.
How Can AI Coding Assistants Impact Cycle Time?
AI assistants can be a huge help, but they mostly supercharge one specific part of the process: the active coding phase. They can shrink this slice of the pie by generating boilerplate code, spinning up unit tests, or suggesting quick fixes for bugs. All of this gets code into the review stage much, much faster.
But here’s the catch: this new speed can easily create a bottleneck downstream if the rest of your process isn’t ready for it. If your code review process is sluggish or your deployment pipeline is manual, all you’ve done is create a bigger pile of work waiting in the next queue. To really see the benefits, you have to look at the whole system and improve the flow through review, QA, and deployment as well.
How Do I Start Tracking Cycle Time Today?
You don’t need a fancy, complicated system to get going. Just start with the basics.
- Get on the Same Page: Huddle with your team and agree on the exact start and end points for your workflow. For example: “Cycle time starts the moment a ticket moves to ‘In Progress’ and ends when the code is deployed to production.” Write it down.
- Use What You Have: Your issue tracker is your best friend here. Tools like Jira automatically log timestamps for every status change. That’s your raw data.
- Find Your Baseline: Pull the data for all the work your team completed over the last 30 days and calculate the average cycle time. That number is your starting point.
Don’t get hung up on making it perfect right away. Just start tracking, bring the numbers to your next retrospective, and use the data to start a conversation. You’ll be surprised at what you find.
Refine Your Cycle Time Calculations
Use these insights to turn raw data into a predictable, high-velocity development process and ship code faster.
📊 Core Metrics
- Average Cycle Time — Your baseline for typical task duration from start to finish.
- Stage-Level Cycle Time — Time spent in key phases like 'Code Review' to find bottlenecks.
- 85th Percentile Time — The realistic upper limit for most tasks, perfect for confident forecasting.
🕹️ My Cheatcodes
- 🌱 Define Start/End Unambiguously — Team-wide agreement on what triggers the clock is non-negotiable.
- 🦎 Visualize the Flow — Use control charts and scatter plots to make outliers and queues impossible to ignore.
- ⚡ Attack Wait Times, Not Work Times — The biggest wins come from shrinking the time work spends waiting between stages.
✅ Before Launching Your Dashboard
- 🔍 Confirm data sources are synced and pulling correct timestamps.
- 📊 Choose visuals that tell a simple story (e.g., CFD for bottlenecks).
- 🧭 Segment data by work type (bugs vs. features) for clarity.
- 📈 Establish your baseline *before* making process changes to measure impact.
Gallery
Lemon shots