
Your Guide to the Cycle Time Calculation Formula

At its core, the cycle time calculation formula is as simple as it gets: End Date - Start Date. This calculation tells you the total time that passed from the moment a task was actively started until it was completely finished.
What Is Cycle Time and Why Does It Matter
Let’s skip the textbook definitions. Cycle time is just the amount of time it takes your team to get a task from “in progress” to “done.”
Think of it like a pizza shop. The cycle time doesn’t start when a customer places their order online. It begins the moment the chef actually starts tossing the dough and adding toppings, and it ends when the pizza is out of the oven, boxed up, and ready to go.

For teams building software, especially with AI-assisted coding, this usually means the time from the very first commit to the final merge. A short cycle time is a huge win—it’s a clear sign of an agile, responsive team that can build and ship valuable features quickly. It replaces guesswork with a hard number that reflects your team’s real-world efficiency.
Understanding the Formula Components
To make this formula work, your whole team needs to agree on what “Start Date” and “End Date” actually mean for your specific workflow. If everyone has a different definition, your metrics will be all over the place. Consistency is everything.
The table below breaks down what these terms typically represent in a software development context.
Cycle Time Formula Components for Software Teams
| Formula Component | Definition in Software Development | Example Event |
|---|---|---|
| Start Date | The timestamp when a developer begins active work on a task. | A developer creates the first commit for a new feature. |
| End Date | The timestamp when the task is fully completed and delivered. | The feature’s pull request is approved and merged into the main branch. |
By clearly defining these start and end points, you can ensure your cycle time data is accurate and meaningful.
While the End Date - Start Date formula is perfect for single items, engineering managers can also look at cycle time from a broader perspective, adapting the classic manufacturing formula: Cycle Time = Total Production Time / Number of Units Produced. For example, if your team ships 100 features in 10 hours, your average cycle time is 6 minutes per feature. That’s a powerful insight that can instantly highlight hidden bottlenecks.
By measuring cycle time, you’re not just tracking speed; you’re creating a feedback loop for continuous improvement. It answers the fundamental question: “How long does it really take us to deliver value?”
To get the full picture of your team’s efficiency, it’s worth exploring comprehensive frameworks like engineering productivity measurement. Ultimately, tracking cycle time is the first step toward building a more predictable and high-performing engineering organization. You can also dive deeper into how to define cycle time with our detailed guide.
Calculating Cycle Time: From Simple to Advanced
Now that we’ve got the “what” and “why” down, let’s get our hands dirty with the actual math. The good news? The cycle time calculation formula starts incredibly simple.
For any single piece of work, it’s just basic subtraction:
Cycle Time = End Date - Start Date
This works perfectly when you’re looking at one specific task, like squashing a bug or adding a small feature. But to really understand your team’s rhythm and predictability, you need to zoom out and look at the bigger picture. That means shifting from a single-task view to an aggregate one.

The Average Cycle Time Formula
To see how your team is performing across an entire sprint or a batch of tasks, you’ll want to calculate the average. This gives you a single, powerful number that represents your team’s typical delivery speed.
Average Cycle Time = Total Sum of All Cycle Times / Number of Tasks Completed
Let’s run through a quick example. Say your team wrapped up five user stories last week, and the individual cycle times looked like this:
- Task A: 2 days
- Task B: 3 days
- Task C: 2 days
- Task D: 8 days (this one was a beast, with a few surprises)
- Task E: 1 day
First, add them all up: 2 + 3 + 2 + 8 + 1 = 16 days. Next, divide by the number of tasks completed: 16 days / 5 tasks = 3.2 days.
So, your team’s average cycle time is 3.2 days. Simple enough, right?
Why Averages Can Lie (and Medians Tell the Truth)
Hold on a second. That 3.2-day average feels a little high, doesn’t it? Most of the tasks were done in 1-3 days. The problem is that the average is easily skewed by outliers.
In our example, Task D took 8 days—way longer than the others. That one complex task dragged the whole average up. If you take it out, the average for the other four tasks drops to just 2 days. That’s a huge difference!
This is exactly why the median is often a more honest metric. The median is simply the middle value when you line up all your data points in order. It isn’t thrown off by those unusually high or low numbers.
Let’s look at our data set again: {1, 2, 2, 3, 8}. The number smack in the middle is 2.
The median cycle time is 2 days. This gives you a much better feel for how long a “typical” task actually takes, protecting your metrics from that one gnarly feature that went off the rails.
This isn’t just theory; it has direct parallels in other fields. For instance, knowing how to calculate CTR in marketing is crucial, and just like with cycle time, understanding outliers and averages is key to getting a true picture of performance.
Master Your Cycle Time Formulas
Use these core calculations to turn raw data into real insights about your team’s delivery speed.
📊 The Core Metrics
- Single-Task Cycle Time: The go-to for measuring one specific work item. Just subtract the start date from the end date.
- Average Cycle Time: Gives you a team-level view of delivery speed across multiple tasks. Great for a quick overview.
- Median Cycle Time: A more accurate picture of a ‘typical’ task’s duration, as it ignores extreme outliers that can skew the average.
🕹️ My Cheat Codes
- Start Simple: Always begin by calculating cycle time for individual tasks. Get a feel for the data before you start aggregating it.
- Beware of Averages: If your data has some wild variations (like a task that took 10x longer than others), lean on the median for a more truthful number.
- Define Your Points: Make sure everyone on the team agrees on what “Start Date” and “End Date” actually mean. Is it when a dev starts coding or when the ticket is assigned? Consistency is everything.
📈 Questions to Ask Yourself
- Is one unusually long-running task making our team’s average look worse than it really is?
- Are we using the right tool for the job—average or median—for our current set of data?
- Do our “start” and “end” points genuinely reflect the active work period, or are we including idle time by mistake?
A Real World Example of Calculating Cycle Time
Formulas are great, but let’s see how this all works in practice. We’ll walk through a real-world scenario that software teams deal with constantly: building and shipping a single feature.
Let’s follow a developer, Alex, who’s been assigned a new task: creating a new API endpoint. The ticket was created on Monday, but Alex was busy wrapping up another project. He finally types the first line of code for this new endpoint on Tuesday morning. That’s our Start Date.
Tracking a Single Task
Alex gets into the zone, coding through Tuesday and Wednesday. By Wednesday afternoon, he’s finished the feature, run his local tests, and pushed his first commit to open a pull request (PR).
This is a huge milestone, but we’re not at the finish line yet. The cycle is only complete once the work is delivered and integrated.
The PR now moves into code review. A teammate looks it over on Thursday morning and requests a few small changes. Alex quickly addresses the feedback that same afternoon. Finally, on Friday morning, the PR gets the green light and is merged into the main branch. This merge is our End Date.
So, let’s calculate the cycle time:
- Start Date: Tuesday at 9:00 AM
- End Date: Friday at 11:00 AM
The total time from the first line of code to the final merge comes out to 3 days and 2 hours. That’s a useful data point for this one task, but the real magic happens when you start looking at the bigger picture.
Zooming Out to the Team Level
Now, think about the whole sprint. Alex’s task was just one of eight features the team shipped. To figure out the team’s average cycle time, you’d need to do the same calculation for the other seven tasks, add them all up, and divide by eight.
But doing this manually gets messy, fast. What happens if a task starts on a Friday afternoon and gets merged on Monday morning? If you just subtract the dates, you’re counting the entire weekend, which bloats your cycle time and skews your data. You have to remove non-working hours to get an accurate read on your team’s actual speed.
The real challenge isn’t the formula itself; it’s the consistent and accurate collection of the start and end data points for every single piece of work, while intelligently filtering out idle time like nights and weekends.
This is exactly why modern tools are a game-changer. Platforms like Zest plug right into developer environments like VS Code and Cursor, automatically capturing the real “start” signal (the first keystroke on a new branch) and the “end” signal (the final merge). It turns a tedious, error-prone manual process into a real-time, actionable dashboard. Instead of getting bogged down in spreadsheets, you get an instant, clear picture of your team’s velocity.
If you’re tired of manual tracking, see how a dedicated cycle time calculator can give you immediate and accurate insights into your team’s performance.
Cycle Time vs Lead Time vs Throughput
It’s easy to get cycle time, lead time, and throughput mixed up. They all measure aspects of your team’s workflow, but they tell very different stories. Getting the distinction right is the key to using the correct cycle time calculation formula to solve the right problems. Think of them as different lenses you can use to examine your team’s performance.
Lead time is what your customer experiences. It tracks the total time from the moment they make a request until that request is fulfilled and delivered. So, if a client asks for a new feature on Monday and it goes live the following Friday, the lead time is five days. It doesn’t matter when your team actually started coding; it’s the full “request-to-delivery” window.
Cycle time, on the other hand, is your internal development clock. It only starts ticking when a developer actually begins the work (say, with the first commit) and stops when the work is finished (usually when the code is merged). This metric is all about your team’s internal efficiency and speed once they’ve picked up a task.
Then there’s throughput. This one is straightforward: it’s a simple count of how many work items your team completes in a given time frame, like a week or a two-week sprint. It answers the basic question, “How much stuff did we get done?”
The image below breaks down the typical stages that make up your cycle time.
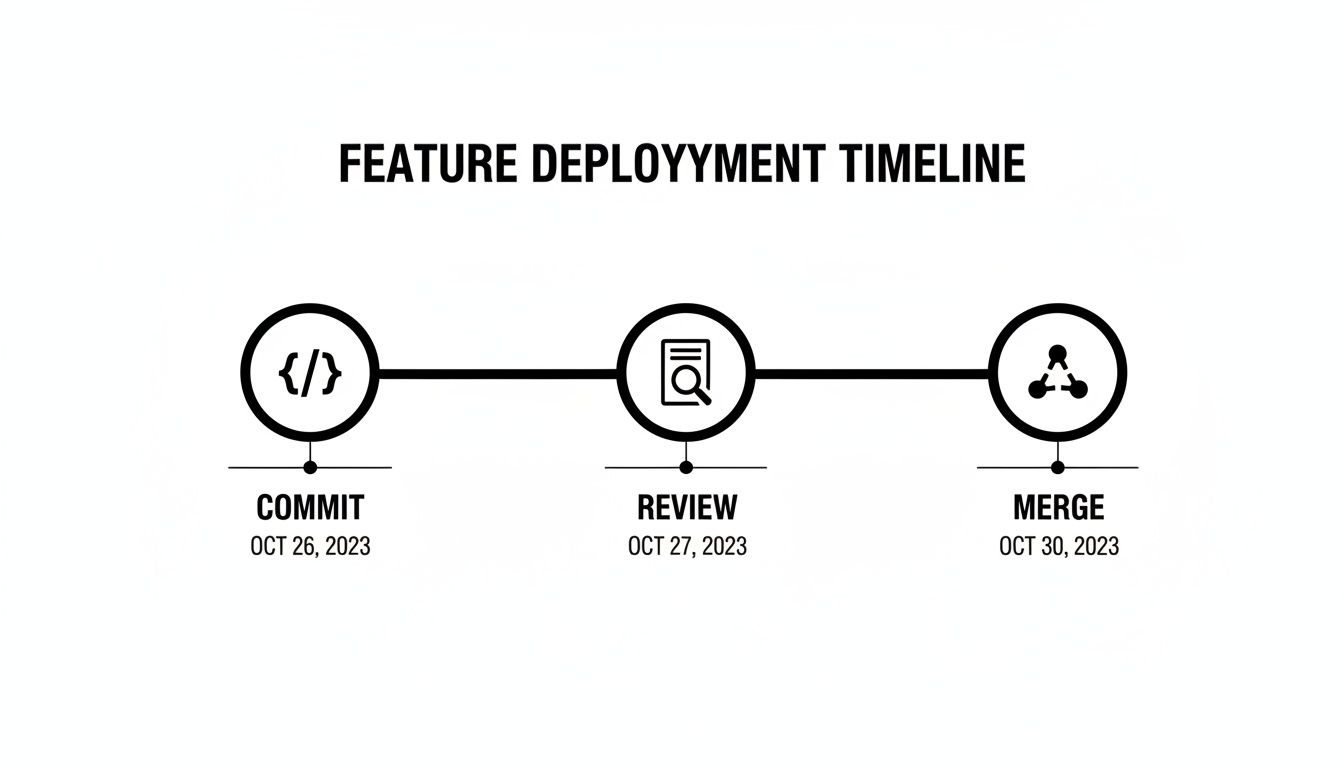
As you can see, it’s not just about the time spent coding. Cycle time includes every active development step, like waiting for code reviews and getting changes merged.
Cycle Time vs Lead Time vs Throughput A Clear Comparison
Understanding the key differences between these three fundamental agile metrics helps you track what truly matters for your team. Lead time is crucial for setting customer expectations, cycle time helps you pinpoint and fix internal bottlenecks, and throughput gives you a high-level view of overall productivity. You can dive deeper into the customer-facing side of things in our guide to lead time in software development.
To make it perfectly clear, here’s a table that lays out what each metric tracks, where it starts and stops, and its main purpose.
| Metric | What It Measures | Start Point | End Point | Primary Focus |
|---|---|---|---|---|
| Cycle Time | The time to complete a task once work has begun. | First commit or “In Progress” | Code merged or “Done” | Internal team efficiency |
| Lead Time | The total time from customer request to delivery. | Request made or ticket created | Feature delivered to customer | Customer experience |
| Throughput | The number of tasks completed in a given period. | Start of a time period (e.g., Sprint Start) | End of a time period (e.g., Sprint End) | Team’s output volume |
Each metric gives you a unique piece of the puzzle. By knowing which one to look at, you can focus your efforts where they’ll have the biggest impact, whether that’s making customers happier or helping your team work smarter.
Common Mistakes to Avoid When Measuring Cycle Time
Knowing the cycle time formula is one thing, but making sure the data you’re plugging into it is actually accurate? That’s where things get tricky. Bad data is often worse than no data at all—it can send your team down a rabbit hole, trying to fix problems that don’t really exist.
Let’s walk through the most common traps that can throw off your metrics and how to sidestep them.
Inconsistent Start and End Points
One of the most frequent errors is a simple one: your team doesn’t agree on when a task officially starts and ends. If one developer considers “start” to be the moment a ticket is assigned, but another thinks it’s when they make their first commit, your data is messy from the get-go. This kind of misunderstanding can seriously inflate your cycle times and hide where the real work—and the real delays—are happening.
The fix is straightforward: get everyone on the same page. A clear, team-wide agreement is non-negotiable.
- Standardize Your Start: A great best practice is to define the start point as the moment the first line of code is written or the first commit is pushed. This focuses the metric purely on active development time, not how long a ticket sat in the backlog.
- Clarify Your End: The end point needs to be just as crystal clear. Is it when the pull request is merged? Or when the feature is live in production? Pick one definition and stick with it for every project.
Consistency here ensures you’re always comparing apples to apples.
Including Non-Working Hours
Another classic mistake is forgetting to exclude weekends and holidays from your calculations. Think about it: a task that starts on a Friday afternoon and gets finished first thing Monday morning didn’t really take three full days of effort.
When you include non-working hours, you artificially inflate your numbers and get a distorted picture of your team’s actual velocity.
Your cycle time calculation should reflect effort, not just the passage of time on a calendar. The best tools automatically filter out nights, weekends, and holidays to give you a clean signal of your team’s real working hours.
Relying Solely on the Average
We touched on this earlier, but it’s worth repeating: the average cycle time can be incredibly misleading. A single, monstrously complex task that takes ten times longer than anything else will drag your team’s average way up. It creates the illusion that everything is slowing down, even when the vast majority of work is flowing smoothly.
To get a more truthful view, you have to look beyond the average. Supplement it with the median and percentile charts. The median tells you the typical experience for a task, while percentiles reveal how consistent—or inconsistent—your workflow truly is.
Finally, you have to be careful not to “game the metric.” If cycle time becomes the one and only performance indicator, you might see developers rushing their work or cherry-picking the easiest tasks just to keep their numbers looking good. This can quietly introduce lower-quality code and a hefty pile of technical debt. Remember, the goal isn’t just to be fast; it’s to be fast and effective.
How to Actually Reduce Your Cycle Time
Knowing your cycle time is one thing; actually shrinking it is the real challenge. The goal isn’t to get developers to type faster. It’s about systematically hunting down and eliminating the friction that grinds your workflow to a halt. The data you’re collecting is a map, and it points directly to your biggest bottlenecks.
Surprisingly, the biggest delays rarely happen during active coding. The real time-sinks are the waiting games—the “in-between” moments. Think about a pull request sitting idle in a review queue for days. Or a developer getting completely stuck on a problem with no one to ask for help. Even just figuring out the right prompt for an AI assistant can burn hours.
This “stuck time” often eats up more of the cycle than the actual hands-on-keyboard work.
Pinpoint and Eliminate Workflow Bottlenecks
Your first job is to find the single biggest source of delay in your process. Is it code review? Vague requirements from product? Or maybe developers are just juggling too many projects at once? You need visibility into the entire development lifecycle to find the answer.
For teams using AI coding assistants in tools like VS Code and Cursor, this means looking for patterns. You might discover that a certain kind of task always leads to longer “stuck times” or takes several tries to get a useful response from the AI. This is where a tool like Zest can give you an edge, using “AI Hints” to flag these exact moments of struggle.
The Zest dashboard below, for example, helps you visualize these patterns and see where the holdups are.
This kind of insight turns “stuck time” into a coaching opportunity. You can see exactly where developers need better prompts, clearer examples, or just more support.
Standardize and Share Winning Workflows
Once you find a process that works and cuts down cycle time, make it the standard. Don’t let that knowledge get stuck with just one developer. For AI-assisted work, this means creating and sharing “cheatcodes”—a library of reusable prompts, templates, and strategies that are proven to work.
Digging into cycle time data reveals just how much of a difference this makes. An analysis of over 10,000 software items found that top teams achieve a median cycle time of just 5 days. That’s a 72% advantage over their peers, driven by a deep, data-backed understanding of their workflows. You can explore more of these cycle time findings.
When you build a shared library of these cheatcodes, you turn one person’s breakthrough into a win for the entire team. This approach doesn’t just help junior developers get up to speed faster; it creates a consistent, high-quality, and efficient process for everyone. You’re turning raw data into a faster, more predictable way to build software.
Frequently Asked Questions
Once you start digging into the cycle time calculation formula, a few practical questions always pop up. Let’s tackle some of the most common ones that teams run into when they first start measuring how fast they ship.
What Is a Good Cycle Time for a Software Team?
Honestly, there’s no magic number. A “good” cycle time is completely relative to your project’s complexity, your team’s size, and even your industry. While you might hear about elite teams shipping in a matter of days, the goal isn’t to hit some arbitrary benchmark you read about online.
The real focus should be on your team’s continuous improvement. Start by measuring your current cycle time to get a clear baseline—that’s your ground zero. From there, the name of the game is making small, consistent reductions. A good cycle time is simply one that’s getting shorter over time.
Should Cycle Time Include Code Review and Testing?
Yes, without a doubt. If you want a real, unfiltered look at your team’s speed, your cycle time has to cover the entire development journey. It should start the moment a developer makes their first commit and only end when that code is merged and truly “done.”
That means you have to include every active stage of the process:
- Initial Coding: The time spent writing the new feature or bug fix.
- Code Review: How long a pull request sits waiting for review and the time it takes to actually review it.
- QA Testing: Any time dedicated to quality assurance checks.
- Rework: The back-and-forth time spent fixing issues found during review or testing.
Leaving these stages out will give you a dangerously rosy picture of your efficiency. It’s like timing a race but stopping the clock before the final lap.
How Can I Start Tracking Cycle Time Without Any Tools?
You can absolutely get started with a simple spreadsheet. For every task your team takes on, just log two dates: the Start Date (when the first line of code is written) and the End Date (when it’s fully merged). The difference between them is your cycle time for that task.
This manual approach is a great way for small teams to get a feel for the concept. But let’s be realistic—it doesn’t scale well and is wide open to human error. For accurate, real-time insights without the busywork, automated tools like Jira or developer-native platforms like Zest are the way to go. They pull data directly from your team’s actual workflow.
Ready to stop guessing and start measuring? Zest automatically captures your team’s cycle time and other critical AI-assisted coding metrics directly from VS Code and Cursor, turning manual effort into actionable insights. See how you can improve your team’s velocity by visiting https://meetzest.com.
Master the Cycle Time Formula
Turn raw data into actionable insights and a clear feedback loop for your team's continuous improvement.
📊 Core Metrics
- Average Cycle Time — The team's typical delivery speed across multiple tasks.
- Median Cycle Time — A more honest metric that ignores outliers for a truer picture of speed.
- Outlier Impact Rate — The difference between average and median to see how much outliers skew data.
🕹️ My Cheatcodes
- 🌱 Standardize Start/End — Define "start" as the first commit and "end" as the final merge for team-wide consistency.
- 🦎 Filter Idle Time — Always exclude non-working hours like nights and weekends for accurate effort measurement.
- ⚡ Automate Everything — Use tools to capture data directly from developer workflows, eliminating manual error.
✅ Before Finalizing Your Metrics
- 🔍 Confirm team-wide agreement on start/end points.
- 📊 Calculate both average and median to spot outliers.
- 🧭 Exclude weekends and holidays from all calculations.
- 📈 Use data to find bottlenecks, not to game the system.
Gallery
Lemon shots



