A Practical Guide to Cursor Troubleshooting
Nothing stops your flow like a frozen editor. When Cursor locks up, your first instinct might be to dive deep into logs, but hold on. The best approach to cursor troubleshooting is to start simple. Most of the time, the fix is something you can knock out in less than five minutes.
Let’s walk through the initial steps that solve the majority of common glitches without needing a degree in computer science.
Your First 5 Minutes: Quick Fixes for Common Cursor Issues
Think of this as triage for your editor. Before you start digging into the complex stuff, you want to rule out the simple, common culprits. A temporary glitch, a bad cache file, or even an issue on Cursor’s end can all cause problems. More often than not, one of these quick checks will get you back to coding.
Start with a full, clean restart. Don’t just click the ‘X’ on the window—completely quit the application. This simple action forces Cursor to clear its temporary memory, which often resolves hangs and unresponsiveness caused by minor state corruption. It sounds basic, but it’s surprisingly effective.
Clear Out the Cache
If a restart didn’t do the trick, your cache is the next suspect. Cursor stores a lot of temporary data to speed things up, but this data can get corrupted over time. This can lead to all sorts of weird behavior, from sluggish performance to the app refusing to start at all.
Clearing the cache forces the application to rebuild those temporary files, giving you a fresh start. It’s a low-risk, high-reward troubleshooting step.
Check for Service Outages
Before you tear your machine apart looking for a problem, take a second to see if the issue is even on your end. The official Cursor status page or their community Discord server are the best places to check.
If their AI features or authentication services are down, that’s your answer right there. This one check can save you hours of wasted effort chasing a problem that isn’t yours to fix.
To help you quickly identify the root of the problem, here’s a simple checklist to run through.
Quick Triage Checklist for Cursor Problems
This table summarizes the initial diagnostic steps you can take to narrow down the cause of common Cursor issues right away.
| Symptom | Potential Cause | First Action |
|---|---|---|
| Editor is completely frozen or unresponsive | Temporary state corruption or memory leak | Fully quit and restart the application. |
| Slow performance or features not loading | Corrupted or outdated cache data | Clear the application cache. |
| AI features (chat, generation) fail | Service outage or network issue | Check the official Cursor status page/Discord. |
| Login or authentication errors | Platform-wide authentication service issue | Check the official Cursor status page/Discord. |
Following these steps in order will help you systematically rule out the most common and easily fixable problems.
This flowchart gives you a visual guide for working through a frozen Cursor instance, starting with the easiest fixes first.
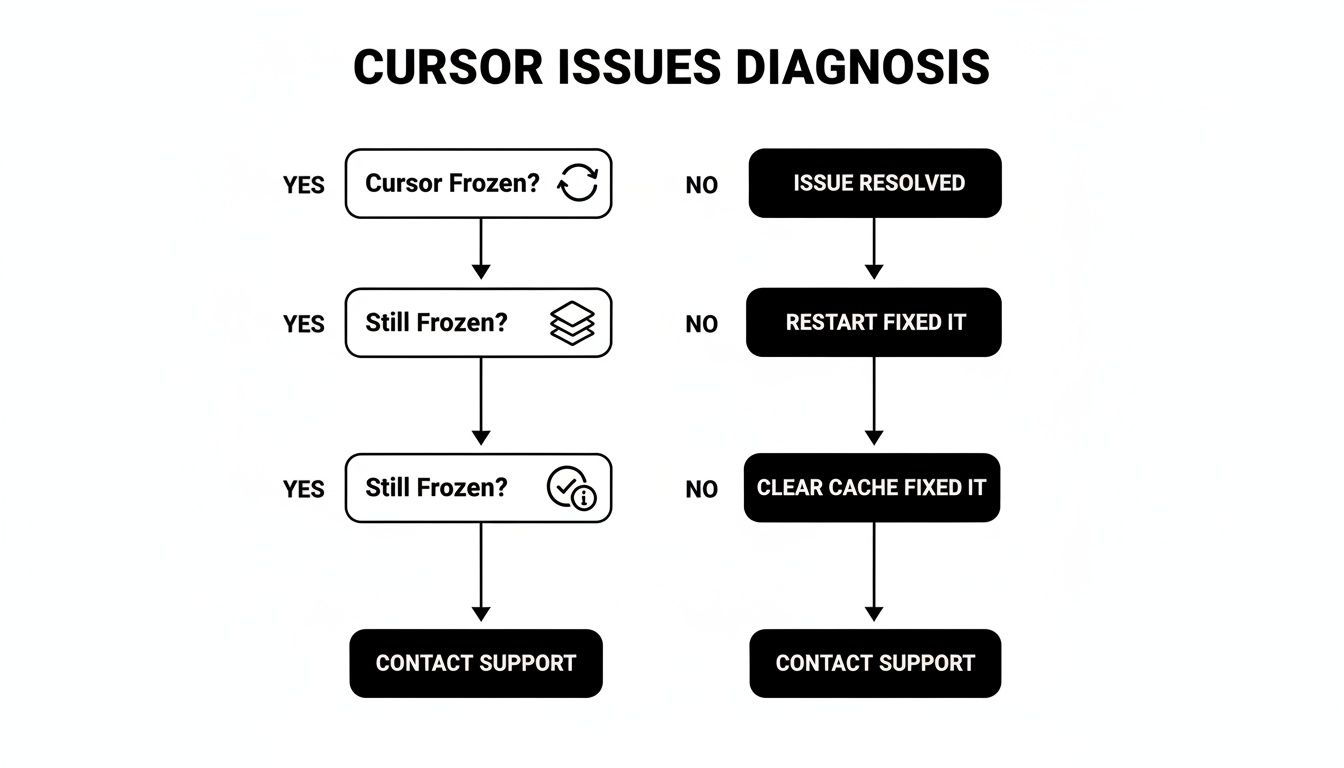
As the chart shows, the idea is to follow a logical path from the least invasive action (restarting) to checking external factors, helping you triage the issue efficiently.
Once you have Cursor running smoothly again, you can explore its more advanced features. For a deep dive, check out our complete Cursor AI tutorial, which covers everything from basic prompts to complex workflows.
And if you’re dealing with a really stubborn problem that started after a recent software update on your machine, don’t forget about your system’s built-in tools. For example, you can utilize System Restore in Windows to roll back recent changes that might be causing a conflict with Cursor.
Diagnosing Performance Lags and Unexpected Crashes
When the quick fixes don’t work, it’s time to dig a bit deeper. A sluggish editor or one that crashes out of nowhere can kill your productivity, and it often points to a resource conflict or a rogue extension.

The first place I always look is system resources. Is Cursor suddenly eating up all your CPU or RAM? Pull up your system’s monitoring tools—Activity Monitor on macOS or Task Manager on Windows—and just watch what happens. If you see a big spike in resource usage right before a freeze or crash, you’ve got your first solid clue.
This can happen during heavy lifting, like indexing a massive repository or running a complex AI command, but it shouldn’t bring your entire machine to its knees.
Isolating Rogue Extensions
Nine times out of ten, instability in a modern editor comes down to extension conflicts. I’ve seen a single, poorly written extension cause memory leaks, sky-high CPU usage, and constant crashes. The trick is figuring out which one is the culprit.
Here’s the classic, methodical approach to hunting it down:
- Go dark. Start by disabling all your non-essential extensions. If Cursor suddenly feels snappy and responsive again, you’ve confirmed an extension is the problem.
- Re-enable one by one. Now, start turning them back on, but only one at a time. After enabling each one, use the editor for a few minutes.
- Watch for the drop. Keep an eye on your system monitor. The moment the lag or instability returns, you’ve found your culprit—it’s the last extension you turned on.
It takes a little patience, but this is the most reliable way to find the source of the conflict without just guessing.
Real-World Scenario: I once worked with a developer whose Cursor would hang for several seconds every time they saved a file. After disabling all extensions, we found an old code formatter that was trying to process a huge, minified JavaScript file in his project. It was causing a massive CPU spike on every save. Disabling it for that workspace fixed the issue instantly.
Managing Large Repositories
Cursor’s performance can sometimes take a hit when you’re working in enormous codebases. That initial indexing process—where the editor scans every file to power its symbol search and AI features—is incredibly resource-intensive. If Cursor becomes unresponsive the first time you open a giant monorepo, this is almost always why.
A simple workaround is to open a specific subdirectory of the project instead of the entire root folder. This dramatically narrows the scope of the initial index, saving a ton of memory and CPU.
If a project still feels slow after that, dive into your settings. You can usually find options to exclude certain directories—like node_modules, build outputs, or asset folders—from file-watching and indexing. It’s a small change, but it can make a world of difference in your day-to-day work.
Tackling AI Feature and Authentication Errors
When Cursor’s AI assistant suddenly goes quiet, it feels like the whole point of using an AI-native editor is lost. If you’re running into issues with Chat, Edit, or Code Generation, it almost always comes down to an authentication hiccup or a network block. It’s frustrating, I know—it stops you dead in your tracks. But the good news is, these problems are usually easy to fix with a quick, methodical check-up.
More often than not, the culprit is a simple API key problem. Whether you’re connecting to OpenAI’s API or another service, that key is your ticket to the AI models. A tiny typo, an expired trial, or a maxed-out rate limit is all it takes to make the AI features seem broken.
First Things First: Check Your Credentials and API Keys
Let’s start with the basics and re-validate your credentials. Don’t just assume they’re right; we’re going to actively check them.
- Head to Cursor’s Settings: Find the section where you entered your AI provider’s details (like OpenAI or Anthropic).
- Re-enter Your API Key: Don’t just eyeball it. Go back to your provider’s dashboard, copy the API key, and paste it fresh into Cursor. Even one wrong character can throw everything off.
- Check Service Status Pages: Before you go any further, pull up the status pages for both Cursor and your AI provider. A service-wide outage on their end can look exactly like an authentication error on your end.
If you’ve confirmed the key is entered correctly, the next stop is your provider’s platform. Log in and make sure your account has enough credits and that the key itself hasn’t been revoked or expired.
A Quick Tip From Experience: I always create separate API keys for different tools. That way, if I need to cycle a key for one app, it doesn’t break my Cursor setup. It also makes it way easier to track usage and costs for each tool.
Think of it like being a detective—methodically checking your settings and logs to pinpoint the source of the problem.

This systematic approach—checking credentials, service status, and key validity—is the fastest way to get your AI features back online.
What If It’s a Network or Firewall Block?
Okay, so your credentials are rock solid. What now? The problem could be hiding in your network connection.
Corporate firewalls, VPNs, and even some aggressive local security software are notorious for blocking the API endpoints that Cursor relies on. This usually shows up as a vague “connection timed out” error, which doesn’t give you much to go on.
For a deeper dive into how these AI functionalities work under the hood, this AI enablement playbook is a fantastic resource.
If you’re dealing with tricky, intermittent AI errors, recording your session is a game-changer. I use a tool called Zest to capture the exact prompts and responses that trigger a failure. This gives you a perfect bug report for the support team or helps you spot weak prompts that you can improve.
To see how Cursor fits into a broader workflow, check out our guide on how to use it with other common dev tools: https://meetzest.com/blog/how-to-use-cursor-with-figma-github-mcp-integration.
When a quick restart doesn’t fix things, it’s time to roll up your sleeves and look under the hood. This is where you stop guessing and start diagnosing, and Cursor’s logs are your best friend for the job. They give you the unfiltered, ground-truth story of exactly what the editor is doing—or failing to do.
Honestly, learning to read these logs is the most valuable troubleshooting skill you can develop. It’s the difference between blindly trying solutions and knowing precisely where the problem is. A good log entry points you to the exact line of code that failed, which is pure gold for solving the problem yourself or filing a bug report that gets a fast, useful response.
Where to Find Your Cursor Log Files
First things first, you need to know where the logs live. Cursor is a complex piece of software, so it keeps different logs for different parts of the application. Figuring out which log to check for a specific problem is half the battle.
There are three main logs you’ll be dealing with:
- Main Process Log: This tracks the core application stuff like startup, window management, and updates. If Cursor is crashing the moment you launch it, this is the first place you should look.
- Renderer Log: This log is all about the user interface—what you actually see and interact with. If you’re running into visual glitches, weird artifacts, or the UI just freezes up, the answer is probably in here.
- Extension Host Log: I find myself in this one most often. It records everything your extensions are doing. If you suspect an extension is slowing things down, causing conflicts, or just not working, this log will tell you exactly what’s going on.
You’ll find these files in the standard application data folders for your operating system. Just search for a “Cursor” folder inside Application Support on macOS, AppData on Windows, or .config on Linux.
How to Actually Read the Logs
Opening a log file for the first time can feel like looking at the Matrix—it’s just a wall of text. But you don’t need to read every line. You’re hunting for keywords.
I always start by searching for terms like ERROR, FATAL, warn, or Unhandled Exception. These are the signposts that point directly to a problem.
Think of an error message as a story. It tells you what went wrong, where it happened (the stack trace), and usually gives you a pretty good hint about why. Your job is to follow that story back to its source.
Once you spot an error, don’t just read that one line. The lines immediately before it are often the most important, as they provide the context. You might see a network request time out right before an AI feature gives up. That’s a direct clue you just can’t get by looking at the UI alone.
Getting these issues sorted out fast really matters. A University of Chicago study found that teams using Cursor merge 39% more pull requests. When the tool isn’t working right, that massive productivity gain disappears. You can read more about the study’s productivity findings to see just how big the impact is.
Using Diagnostic Commands for a Live Look
Sometimes, you need to see what’s happening right now, not just what was recorded in a file. For that, Cursor has a set of real-time diagnostic tools you can access from the command palette (usually Cmd/Ctrl + Shift + P).
For example, running Developer: Show Running Extensions gives you an instant snapshot of every active extension and its startup time. It’s a ridiculously easy way to spot a sluggish plugin that’s making your whole editor feel slow. Getting comfortable with these commands changes troubleshooting from a reactive chore to a proactive skill.
Proactive Strategies to Prevent Future Issues
The best way to troubleshoot Cursor isn’t to get better at fixing bugs—it’s to stop them from happening in the first place. When you shift from a reactive, “firefighting” mindset to one of proactive maintenance, your entire development experience changes. You’ll spend less time wrestling with the editor and more time actually coding.

It all comes down to building a few solid habits. Things like staying on top of updates, clearing your cache now and then, and being picky about your extensions can wipe out a huge number of common problems before they ever get a chance to start.
Curate Your Environment
Think of your Cursor setup like a workshop. Every tool should have a clear purpose. An environment cluttered with dozens of extensions—many of them outdated or unused—is one of the biggest sources of instability I see. A cleaner, more minimalist approach is almost always more resilient.
Make a habit of auditing your installed extensions. If you haven’t touched one in the last month, seriously ask yourself if you still need it. Disabling or uninstalling what you don’t use reduces the potential for conflicts and frees up system resources, giving you a faster, more reliable editor.
Adopting a “less is more” philosophy with your extensions is a powerful preventative measure. A clean setup is a stable setup, and it makes isolating future problems way easier because you have fewer variables to worry about.
And, of course, stay on top of Cursor updates. This one is non-negotiable. Every release packs in bug fixes and performance tweaks that directly address known issues. If you’re running an old version, you’re willingly exposing yourself to bugs that have already been squashed.
Build a Personal Knowledge Base
Here’s one of the most powerful things you can do: document the issues you solve. Don’t just fix something and forget about it. Create your own personal knowledge base—it can be as simple as a Markdown file or a dedicated notes app where you log the symptom, the cause, and the fix.
This pays off in a few huge ways:
- Spot Recurring Patterns: You’ll start to see if the same kinds of problems keep popping up, which usually points to a deeper root cause you can address.
- Accelerate Future Fixes: When an issue comes back months later, you won’t have to troubleshoot from square one. Your notes will give you a direct path to the solution.
- Share Solutions: This little database becomes an incredible asset for your team. Colleagues can learn from what you’ve already figured out.
To really level up your documentation, use a tool like Zest to grab a quick video of the bug as it happens. A screen recording gives you perfect, context-rich evidence that’s far better than trying to describe an intermittent or complex issue in words. This is especially useful for improving your own workflow, and we cover more strategies in our guide to Cursor AI best practices.
This kind of proactive management is becoming the norm. For example, Cursor’s own internal AI help desk successfully handles 80% of its employees’ support tickets, proving how well-documented systems cut down on wasted time. You can discover more insights about their internal systems on fortune.com. By making these habits your own, you’ll build a much more resilient and efficient development workflow.
Common Questions About Cursor Troubleshooting
Even when you’re careful, you’ll eventually run into a snag. It happens. Let’s walk through some of the most common questions I hear from developers trying to figure out what’s wrong with Cursor, with some straightforward advice to get you coding again.
Why Is Cursor So Slow on My Machine?
“Cursor feels sluggish” is probably the number one complaint I see. It’s frustrating when your editor can’t keep up. Before you blame the app itself, let’s look at the usual suspects. Nine times out of ten, the bottleneck is one of these things.
- Extension Overload: This is the big one. We all love our extensions, but too many active at once will absolutely bog things down. Do a quick audit—if you aren’t using an extension daily, disable it.
- Massive Repository Indexing: If you just opened a huge monorepo for the first time, Cursor is working hard in the background to index everything. Just give it a few minutes to finish. A good trick is to open a smaller sub-directory first to let it warm up.
- Hardware Limitations: Let’s be real—Cursor and its AI features can be demanding. If you’re running on a machine with less than 16GB of RAM or an older CPU, you’re likely to see some lag, especially during heavy tasks.
- Outdated Version: The Cursor team is constantly shipping performance tweaks and bug fixes. Make sure you’re running the latest version. It’s a simple check that can make a huge difference.
- Corrupted Cache: Over time, caches can get bloated or corrupted. It’s just a fact of life. Clearing it out is often a quick fix that brings back that snappy feel.
How Do I Completely Reset Cursor?
Sometimes, things get so tangled that the only real solution is to start over from scratch. If you’re hitting weird, persistent bugs that you just can’t explain, a full reset might be your best bet. This is the “nuke it from orbit” option—it will wipe all your settings, extensions, and user data.
Important: Before you do this, please, please back up your
settings.jsonfile and take a screenshot of your installed extensions list. It will save you a ton of headache when you’re setting things back up.
To do a full reset, you’ll need to find and delete Cursor’s configuration directory. The location depends on your OS:
- Linux: Look in
~/.config/ - macOS: Check
~/Library/Application Support/ - Windows: You’ll find it in
%APPDATA%\
Just delete the “Cursor” folder in there. The next time you launch the app, it will be like a brand-new installation.
What Should I Include in a Bug Report?
Okay, so you’ve tried everything and you’re still stuck. Time to ask for help. A great bug report can be the difference between getting a fix in hours versus getting ignored. A vague “it’s broken” ticket isn’t going to get you very far.
You want to make it as easy as possible for someone to understand and, most importantly, reproduce your problem. Here’s the anatomy of a perfect bug report:
- A Clear, Descriptive Title: Be specific. Instead of “Chat is buggy,” try “AI Chat Crashes When Pasting Large Code Snippets.”
- Your System Specs: Always include your operating system (e.g., macOS Sonoma 14.5), your Cursor version, and any relevant hardware details.
- Steps to Reproduce: This is absolutely critical. Write down the exact, step-by-step actions someone needs to take to see the bug for themselves.
- What You Expected vs. What Happened: Clearly state the outcome you were hoping for and then describe the actual (buggy) result.
- Relevant Log Snippets: We talked about finding logs earlier. Grab any
ERRORorFATALmessages from the time the bug occurred and paste them in. This is pure gold for developers.
Put in the effort to write a good report, and you’ll be amazed at how much faster you get a helpful response.
Stop losing momentum to workflow friction. With Zest, you can capture, measure, and improve your AI-assisted coding in Cursor and VS Code. Turn every session into a learning opportunity, share winning strategies with your team, and ship faster. Get started for free at https://meetzest.com.
Master Cursor Troubleshooting
Use this scorecard to transform from reactive bug-fixing to proactive performance management in your editor.
📊 Core Metrics
- Time-to-Resolution — Average time spent diagnosing and fixing an editor issue, from freeze to fix.
- Extension Conflict Rate — Percentage of issues traced back to a misbehaving or outdated extension.
- Uptime Percentage — The amount of coding time free from editor-related interruptions.
🕹️ My Cheatcodes
- 🐢 Triage First — Always start with the 5-minute fixes (restart, clear cache, check status) before deep diving.
- 🧩 Isolate Extensions — The one-by-one re-enable method is the most reliable way to find a rogue plugin.
- 📜 Logs Tell the Truth — Search logs for `ERROR` or `FATAL` to get straight to the root cause.
✅ Pre-Code Checklist
- 🔍 Check for Cursor updates before starting a long session.
- 🧹 Disable any extensions not needed for the current project.
- 📊 Verify API key status if AI features are critical.
- 📝 Have your personal knowledge base open for quick reference.
Gallery
Lemon shots