Calculate Cycle Time to Optimize Your Workflow

To get a handle on your team’s cycle time, you’re essentially measuring the total time that passes from the moment work actually starts on a task until it’s officially finished. The formula couldn’t be simpler: Completion Date minus Start Date. This metric zeroes in on the active work period, which makes it an incredibly sharp tool for spotting holdups and boosting your workflow’s efficiency.
What Is Cycle Time and Why Does It Matter

If you’re looking for an honest metric, cycle time is it. It doesn’t care how long a task sat in the backlog collecting dust. All it measures is the raw, hands-on time spent building something.
Think of it like this: a stopwatch starts the second a developer drags a ticket into “In Progress” and doesn’t stop until that work is truly “Done.” That duration is your cycle time.
This single number gives you the pulse of your development engine. When your cycle time is short and consistent, you know you have a healthy, predictable workflow. But if it’s long or all over the place? That’s a red flag waving you down, signaling there’s friction, a bottleneck, or some other inefficiency you need to investigate.
The Critical Difference Between Cycle Time and Lead Time
It’s easy to get these two confused, but they measure completely different things. Getting this right is the first step to making real improvements to your process.
In short, Lead Time is what your customer experiences. It’s the clock that starts ticking the moment a feature is requested and stops only when it’s delivered. That includes all the waiting around in the backlog. On the other hand, Cycle Time is your internal team metric. It only measures the active development phase, ignoring any time the task spent in the queue.
For a deeper dive into this key concept, check out our comprehensive guide that fully explains the cycle time definition and its nuances.
Here’s a quick table to make the distinction crystal clear.
Cycle Time vs Lead Time A Quick Comparison
| Metric | Starts When… | Ends When… | What It Measures |
|---|---|---|---|
| Cycle Time | Work actively begins on a task. | The task is considered “Done.” | The speed and efficiency of your active development process. |
| Lead Time | A request is first made or approved. | The request is delivered to the user. | The total time from customer request to value delivery. |
Understanding this matters because each metric tells you where to look for problems. A long lead time paired with a short cycle time points to an issue with prioritization or planning. But a long cycle time? That means the inefficiency is hiding somewhere inside your development process itself.
Why Top Teams Obsess Over This Metric
High-performing teams don’t just track cycle time; they live by it. They use it as their North Star for continuous improvement, and the benefits go way beyond just shipping faster.
Shorter cycle times make your team more predictable, which means more accurate project scopes and realistic deadlines. They also create much tighter feedback loops. When you can build, release, and learn in days instead of weeks, you can deliver what users actually want, not what you thought they wanted a month ago.
This isn’t just a software thing, either. The need for a tight, efficient process is universal. In smart manufacturing, for example, new tech aimed at shortening workflows can slash cycle times by around 20-30%. The principle is the same in development: a streamlined process is a more effective and profitable one.
Calculating Cycle Time with a Real-World Example
Alright, theory is great, but let’s get our hands dirty. The best way to really wrap your head around cycle time is to walk through a real-life example. We’ll follow a single feature request from the moment a developer picks it up until it’s live.
Let’s imagine your team is tasked with adding a “dark mode” toggle to your app. A developer, we’ll call her Alex, gets the ticket. First things first, we have to agree on what “start” and “end” actually mean for our process. This is a crucial step that a lot of teams gloss over.
For this example, let’s set some clear goalposts:
- Start Point: The instant a ticket is dragged from ‘To Do’ into the ‘In Progress’ column in your Jira or Linear board. This is the signal that active work has begun.
- End Point: The moment the feature’s pull request is merged into the main branch after getting the green light from code reviews and passing all automated checks.
With these definitions locked in, we can start the clock.
The Feature Journey, Day by Day
Let’s say Alex pulls the “Dark Mode Toggle” ticket into ‘In Progress’ on Monday at 10:00 AM. That’s our official start time. The cycle time for this task is now ticking.
Alex dives in, coding away through Monday and Tuesday. By Wednesday morning, she’s got a working version and opens a pull request for her teammates to review. The ticket stays ‘In Progress’ because waiting for feedback is absolutely part of the development cycle. It’s not “done” until it’s merged.
After a bit of back-and-forth in the PR comments, Alex makes a few requested tweaks. The PR gets the final approval and is merged on Wednesday at 4:00 PM. This is our official end time.
Now for the simple math. We just subtract the start time from the end time:
- End Time: Wednesday, 4:00 PM
- Start Time: Monday, 10:00 AM
The total elapsed time is 2 days and 6 hours.
But What About Nights and Weekends?
Here’s where a lot of teams get it wrong. Simply looking at the total calendar time can be really misleading. Did Alex really work for 54 hours straight? Of course not. A much more accurate and useful cycle time calculation only considers actual working hours.
If your team works a standard 8-hour day, say 9 AM to 5 PM, the calculation changes completely:
- Monday: 7 hours of work (from 10 AM to 5 PM)
- Tuesday: 8 hours of work (a full 9 AM to 5 PM day)
- Wednesday: 7 hours of work (from 9 AM until the 4 PM merge)
The True Cycle Time: Adding it all up, the actual cycle time for this feature was 22 working hours. This number is infinitely more valuable than “2 days and 6 hours.” It reflects the real effort invested and gives you a much cleaner signal about your team’s actual velocity.
Gathering Accurate Cycle Time Data
Your cycle time metric is only as good as the data you feed it. To get a real, unvarnished look at your team’s velocity, you need accurate timestamps. The trick is to capture this information without forcing your developers into tedious, manual data entry—after all, the measurement process shouldn’t become another bottleneck.
The old-school way of doing this is manual tracking. You know the drill: developers are supposed to meticulously update their tickets in Jira or Asana, dragging them from ‘To Do’ to ‘In Progress’ and then to ‘Done’ at the exact moment the work starts and stops. On paper, it seems simple enough. In reality, it hinges entirely on human memory and discipline, which… well, it’s not always consistent. One forgotten status update, and a task that took a couple of hours suddenly looks like it took two days.
Manual vs. Automated Tracking
The big problem with manual tracking is that it’s really just an approximation. It tells you when someone remembered to update a ticket, not when the work actually began or ended. This injects a ton of guesswork and human error into your data, potentially hiding the very inefficiencies you’re trying to uncover.
This is where automated data collection comes in. It’s a much cleaner, more modern approach. Instead of relying on manual ticket updates, specialized tools plug directly into a developer’s primary workspace: their IDE. These tools run quietly in the background, logging start and end times based on actual keyboard activity, code commits, and pull requests.
This simple flow shows what we’re aiming to measure—the time from starting the work to finishing it.
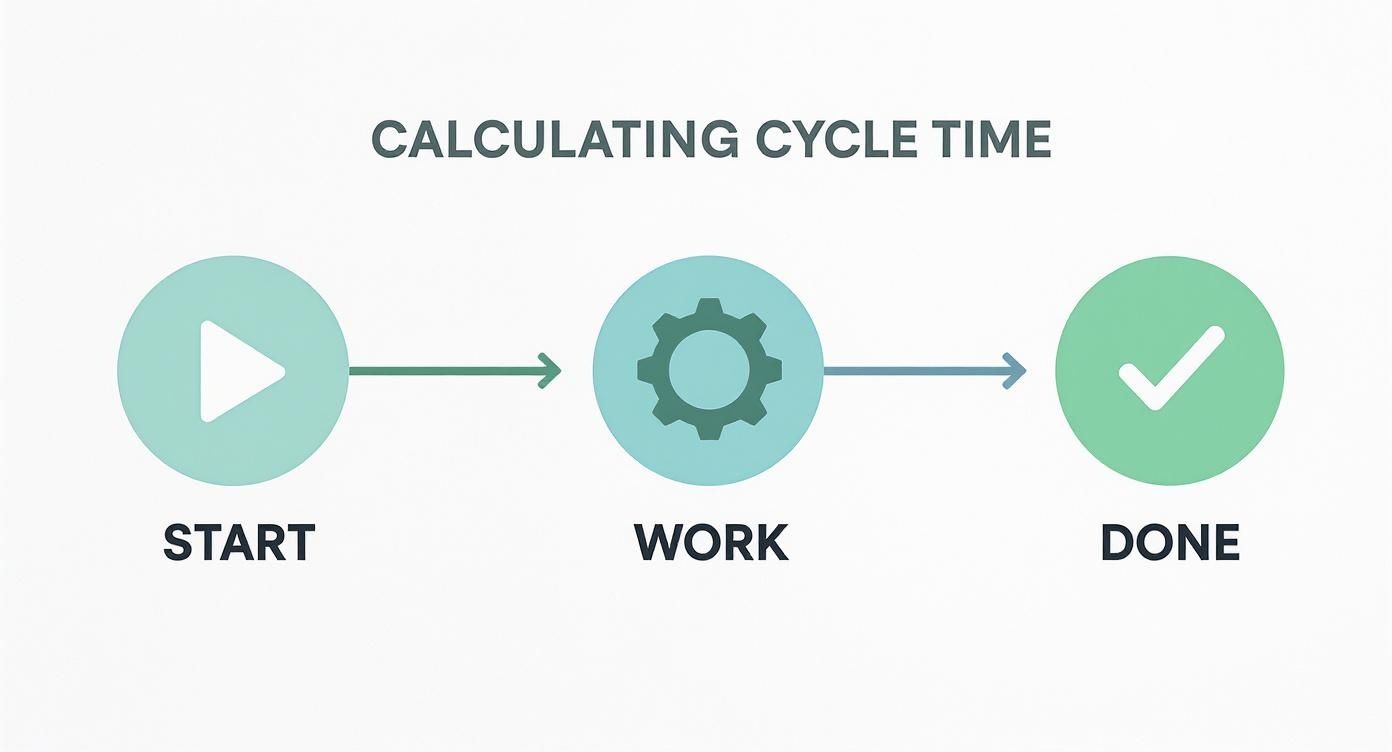
The crucial insight here is that you get the most accurate data by tracking the work itself, not just the ticket’s journey across a Kanban board.
The Power of IDE Integration
Tools that integrate with editors like VS Code or Cursor provide a ground-truth measurement of cycle time. They capture the real-time signals that manual tracking completely misses, giving you a metric based on actual effort, not just reported status. This shift away from relying solely on project management software is a game-changer. For a deeper dive, it’s worth understanding how different types of lead time software also tackle this data collection problem.
The Takeaway: Automated, IDE-based tracking cuts through the friction and inaccuracy of manual data entry. It elevates cycle time from a fuzzy estimate to a precise diagnostic tool based on when a developer is truly hands-on-keyboard.
This obsession with efficiency isn’t new. It has deep roots in Lean Manufacturing principles, which were all about eliminating waste to shrink production cycles. That same drive is alive and well today. A Deloitte manufacturing industry outlook found that 80% of manufacturers plan to invest over 20% of their R&D budgets into factory improvements, with cycle time as a key focus. The context might be different, but the core principle is identical: accurate measurement is the first step toward real improvement. By automating data collection, software teams can finally bring that same level of rigor to their own work.
Turning Cycle Time Data into Actionable Insights
So, you’ve started to calculate cycle time. That’s a huge step. You’ve officially moved beyond guesswork and into the world of data-driven improvement. But raw numbers are just noise—they don’t tell you much on their own. The real magic happens when you turn that data into a story that shows you exactly where your workflow shines and where it’s getting bogged down.
Just looking at an average cycle time can be really misleading. A team might boast a three-day average, but that number could be hiding a chaotic reality where some tasks fly through in hours while others get stuck in limbo for over a week. To get to the truth, you have to dig deeper.
Beyond the Average to Uncover Trends
To really get a feel for your team’s performance, you need to look at the distribution of your cycle times, not just the middle number. A scatter plot is your best friend here. By plotting the cycle time for every completed task over a set period, you get an instant visual of your workflow’s health.
Are the dots on your plot clustered tightly together? That’s a great sign—it points to a consistent, predictable process. Or are they scattered all over the place? That signals unpredictability, which is often a symptom of hidden bottlenecks, scope creep, or poorly defined tasks. Those outliers—the tasks that took way longer than everything else—are your starting point for investigation.
I’ve learned that a focus on consistency over raw speed is the hallmark of a mature development process. A team that predictably delivers work in a 3-4 day cycle is far more valuable and easier to plan around than a team that swings between 1-day miracles and 10-day slogs.
Asking Smarter Questions
With this visualized data in hand, you can stop asking vague questions like, “How can we be faster?” and start asking much more specific, targeted ones.
- Which stage is the real time sink? Is it the actual coding, the waiting game for a code review, or the back-and-forth during QA?
- Do certain types of tasks always take longer? Maybe bug fixes are quick wins, but new feature development consistently drags on for weeks.
- Are our code reviews a bottleneck? If you see tasks piling up in the “In Review” column for days on end, you’ve found a major opportunity for improvement.
This isn’t a new concept. In fact, leading manufacturers use detailed production cycle data from over 15 years to forecast output and dial in their processes. As you can discover in more detail from Interact Analysis, having that rich historical data allows them to fine-tune productivity with incredible accuracy. We can do the same.
Connecting Data to Real-World Improvements
At the end of the day, cycle time is a diagnostic tool. It tells you where to look, but it’s up to you and your team to uncover the why. Every outlier on your scatter plot has a story. Was the ticket poorly defined from the start? Did the developer get pulled into firefighting other urgent issues? Was there a key dependency that was blocked for days?
By digging into these anomalies, you shift from just measuring things to actively managing and improving your workflow. This is how you transform raw data into a powerful engine for continuous improvement. By focusing on the patterns and the outliers, you connect your metrics to meaningful, real-world changes that make your entire team more effective. For more on this, our guide on engineering performance indicators offers a broader look at metrics that drive success.
Proven Strategies to Reduce Your Cycle Time
Once you’ve calculated your cycle time and analyzed the data, the real work begins: shrinking it. This is where insights turn into action. Reducing cycle time isn’t about making people work faster or cutting corners—it’s about methodically removing friction from your development process.
By targeting the common bottlenecks, you create a smoother, more predictable workflow. The goal is a steady flow of value, not a chaotic cycle of frantic sprints followed by long, frustrating waits. Each strategy here is designed to tackle a specific type of delay, giving you the tools to make an immediate impact.
Break Down Work into Smaller Batches
One of the single most effective ways to slash your cycle time is to shrink the size of the work itself. Large, monolithic features are notorious for getting stuck. They’re complex, hard to estimate, and introduce a ton of risk. Unsurprisingly, they often languish in review or QA for days simply because there’s so much to test and verify.
The fix? Relentlessly break down big epics into small, independently deployable user stories. A great rule of thumb is that any single piece of work should be small enough to go from “In Progress” to “Done” in just a couple of days.
This approach pays off in several ways:
- Faster Feedback: Smaller changes are easier to review, test, and merge. This dramatically shortens the feedback loop.
- Reduced Risk: If a small change introduces a bug, it’s far easier to pinpoint and roll back than a massive feature release.
- Increased Momentum: Shipping small wins frequently builds team morale and shows consistent progress to stakeholders.
Streamline Your Code Review Process
The code review stage is often where momentum dies. A pull request that sits idle for two days has just added 48 hours to its cycle time before anyone has even looked at it. You have to combat this by treating code review as a high-priority part of the development cycle, not an afterthought.
A key principle for a healthy workflow is that the team’s responsibility doesn’t end when they push code; it ends when that code is merged and deployed. This mindset shift turns code review from a gate into a collaborative checkpoint.
Set clear expectations for review turnaround times. For example, a team might agree that all PRs should get a first review within 4 business hours. Even better, automate everything you can. Use linters, static analysis tools, and automated tests to catch simple errors before a human ever sees the code. This lets your team focus their valuable time on the important stuff—like logic and architecture—not on nitpicking code style.
Optimize Your CI/CD Pipeline
Your Continuous Integration and Continuous Deployment (CI/CD) pipeline is the engine of your workflow. A slow, unreliable pipeline directly translates to longer cycle time. If your test suite takes 45 minutes to run, every single commit is saddled with that delay, guaranteed.
Take a hard look at your build and deployment process to find the slowest stages. Can you run tests in parallel? Can you optimize the build environment with better caching? Shaving even 5-10 minutes off your build time can add up to hours of saved time every week across the team. A fast, stable pipeline is a genuine force multiplier.
The table below highlights some of the most frequent issues I see that inflate cycle time, along with practical ways to tackle them.
Common Cycle Time Bottlenecks and Solutions
| Common Bottleneck | Primary Cause | Actionable Solution |
|---|---|---|
| Long Code Review Queues | Lack of clear ownership or team norms; reviewers are overloaded with other tasks. | Set a team-wide SLA for first review (e.g., < 4 hours). Use a “round-robin” or designated reviewer system to distribute the load. |
| Slow CI/CD Builds | Unoptimized test suites, inefficient build steps, or under-powered build agents. | Profile the pipeline to find slow stages. Parallelize tests, implement caching for dependencies, and scale up build hardware. |
| Large, Complex Pull Requests | Work is not broken down into small, independent chunks before development begins. | Enforce a “small batches” policy. A PR should focus on one thing and be reviewable in under 15-20 minutes. |
| Frequent Context Switching | High Work-In-Progress (WIP) limits; developers are juggling too many tasks at once. | Implement and enforce strict WIP limits (e.g., 1-2 active tasks per developer). Encourage finishing tasks before starting new ones. |
| Manual QA & Testing Delays | Over-reliance on manual testing for things that could be automated. | Invest in building a robust automated test suite (unit, integration, E2E). Use feature flags to decouple deployment from release. |
By systematically addressing these common culprits, you can stop fighting fires and start building a truly efficient and predictable development flow.
Answering Your Top Questions About Cycle Time
As you start tracking cycle time, a few questions always come up. Here’s a quick rundown of the most common ones I hear, designed to clear up any confusion and get your team on the right track from day one.
What’s the Difference Between Cycle Time and Lead Time Again?
This is easily the most common mix-up, but the distinction is everything.
Lead Time is what your customer experiences. It starts the moment a request is made and ends only when it’s delivered. Think of it as the entire journey, from the initial idea sitting in a backlog to the final release.
Cycle Time, however, is your team’s internal clock. It only starts ticking when a developer actually begins working on a task and stops the second it’s finished. It’s purely a measure of active development.
A long lead time with a short cycle time usually points to a problem with your planning or prioritization. But a long cycle time? That’s a sign of a bottleneck right inside your development process.
How Often Should We Be Looking at These Metrics?
You want to review the data often enough to be useful, but not so often that you’re just chasing noise. I’ve found the sweet spot is discussing cycle time trends during your team’s regular retrospectives, whether that’s weekly or bi-weekly.
This rhythm is perfect because it lets you:
- Spot meaningful trends instead of reacting to daily blips.
- Dig into any outliers from the last sprint while the details are still fresh in everyone’s mind.
- Base your process improvement discussions on hard data, not just gut feelings.
What Are the Best Tools for Tracking Cycle Time?
You can track this stuff manually in tools like Jira or Asana, but honestly, it’s a recipe for inaccurate data. People forget to update statuses, and you end up with garbage numbers.
The best data comes from tools that hook directly into your developer’s workflow.
Modern plugins for IDEs like VS Code or Cursor are a game-changer here. They can automatically log start and end times based on real coding activity, commits, and pull requests. This removes all the guesswork and gives you a true picture of when work is actually happening, making it way easier to calculate cycle time accurately. Automation is what turns this from a vanity metric into a powerful diagnostic tool.
Optimize Your Workflow Scorecard
Use these core principles to move from simply calculating cycle time to actively shrinking it for a more predictable development flow.
📊 Core Metrics
- Average Cycle Time — The mean duration from task start to completion.
- Cycle Time Consistency — A measure of predictability, visualized as a tight cluster on a scatter plot.
- Outlier Frequency — The percentage of tasks that take significantly longer than the average, highlighting bottlenecks.
🕹️ My Cheatcodes
- 🌱 Automate Data Collection — Ditch manual ticket updates. Use IDE-based tools for accurate, ground-truth data.
- 🦎 Break Down Work — Enforce a "small batches" policy to ensure features are reviewable and shippable in days, not weeks.
- ⚡ Focus on Consistency, Not Speed — A predictable team that ships consistently is more valuable than a team with volatile output.
✅ Before Your Next Retro
- 🔍 Define "Start" and "Done" with your team.
- 📊 Visualize your cycle times on a scatter plot.
- 🧭 Identify the top 1-2 outliers from the last sprint.
- 📈 Discuss the 'why' behind each outlier as a team.
Gallery
Lemon shots