
A Developer Guide to AI Code Debug
It feels like AI coding assistants are everywhere now, and while they’re fantastic at churning out code, they’ve created a brand new headache: debugging. Tools like GitHub Copilot can spit out code in seconds, but then we, the developers, are left spending hours tracking down tiny, almost invisible bugs in that “almost-right” code. Learning how to effectively debug AI-generated code isn’t just a nice-to-have skill anymore—it’s essential if you want that speed to actually mean something.
The Hidden Cost of AI-Generated Code
We’re in a bit of a weird spot with AI coding tools. We can write first drafts faster than ever, but that time saved often gets poured right back into figuring out why the AI’s logic is just slightly off. The developer’s job is shifting from being just a creator to being a high-level validator.
This all comes down to how these AI assistants work. They’re incredible at recognizing patterns from the mountains of code they were trained on, but they don’t really understand the specific context of your project. This creates some pretty common frustrations that can completely derail your workflow.
Common Friction Points with AI Code
I’ve seen these pop up time and time again:
- Subtle Logical Flaws: The code looks perfect. It might even pass a few simple tests. But as soon as you hit an edge case the AI never considered, it all falls apart.
- Context-Blind Suggestions: The AI will offer up a fix that seems great on its own, but it has no idea that it’s about to break three other dependencies across the application.
- Increased Code Duplication: Without careful oversight, AI tools can easily suggest snippets that are just copies of existing code, creating a maintenance nightmare down the road.
This isn’t a small problem. Projections show that AI-generated code could make up 41% of all code written globally by 2025. But quality is still a massive question mark. Take GitHub Copilot—it has a code completion rate of 46%, yet developers only end up accepting around 30% of its suggestions. That gap tells you everything you need to know about the need for better debugging workflows.
The core challenge isn’t the AI’s speed but its precision. The time gained generating 100 lines of code is lost if you spend an hour debugging a single, subtle error within it.
Once you get your head around this, things get easier. Instead of thinking of your AI assistant as a flawless senior dev, treat it more like a super-fast but slightly naive junior developer. It needs clear instructions, constant validation, and a solid process to truly be helpful. If you want to dig deeper into this shift, check out our guide on AI for code. Adopting this mindset is the first real step toward mastering AI-assisted debugging.
Why AI Fumbles on Complex Bugs
To get the most out of an AI assistant for debugging, you first need to know its limits. Modern AI models are amazing at catching syntax errors or spitting out boilerplate code, but they often hit a brick wall when the real debugging begins. This isn’t just about pattern recognition; it’s a fundamental gap in understanding.
Your AI doesn’t really get your project’s architecture. It has no clue about the subtle dance between different modules or the specific business logic that led to a piece of code being written in the first place. It sees the code but completely misses the why. This is exactly how it can confidently offer a “fix” that looks perfect in a vacuum but ends up breaking five other things downstream.
The Real Problem Is a Lack of Experience
At its core, this is a data problem. AI models have been trained on mountains of open-source code, but they haven’t been trained on enough examples of how an actual developer thinks through a bug. They lack a deep well of data showing a human setting a breakpoint, inspecting a variable, forming a hypothesis, and then pivoting when that theory proves wrong.
The numbers back this up. A 2025 Microsoft study put nine different AI models to the test against 300 real-world software bugs. The results? Even the top performer, Claude 3.7 Sonnet, only got it right 48.4% of the time. You can dig into the details in this Microsoft study on AI debugging. The research is clear: the models just don’t have enough training data that captures the sequential, human-like decision-making that debugging requires.
Know Your Tool and Its Limits
Understanding these weaknesses is key to using AI effectively. Don’t treat your AI assistant like a magic wand. Instead, think of it as a very fast, very specialized junior dev.
- It’s great at surface-level stuff: Perfect for linting, fixing typos, and refactoring simple, isolated functions.
- It gets lost in the weeds: Don’t throw a complex, multi-file architectural bug at it and expect a perfect solution without a lot of hand-holding.
- It needs you to be the senior dev: The AI’s output is always a suggestion, never a final answer. You have to be the one to sign off on it.
Your job is to pair your deep, contextual knowledge with the AI’s raw pattern-matching power. The AI gives you possibilities; you provide the validation.
This is a lot like how we use tools for static code analysis. An automated tool flags potential issues, but it’s always a human developer who makes the final judgment call. By keeping these boundaries in mind, you’ll write much better prompts and avoid the frustration that comes from hitting the AI’s blind spots.
Crafting Debugging Prompts That Actually Work
When you’re debugging with an AI, the quality of your entire session comes down to one thing: your prompt. Tossing out a lazy, low-effort prompt like “fix this bug” is a surefire way to get a generic, often useless, guess back from the AI. But get the prompt right? It feels like you’ve unlocked a superpower, turning your AI assistant into a genuinely insightful pair programmer.
The secret isn’t just about writing more; it’s about being strategic. Forget just throwing a chunk of code over the fence and hoping for the best. The most effective approach is a repeatable mental model that gives the AI everything it needs to move from guessing to reasoning.
Think Like You’re Filing a Bug Report
I’ve found the best way to structure my prompts is by following what I call the Context-Error-Goal method. It’s a simple, three-part structure that I apply to pretty much every debugging prompt I write. Using this consistently will dramatically boost the quality of the AI’s suggestions and save you from those frustrating, time-wasting back-and-forths.
Here’s how it breaks down:
-
Context: This is the “where.” You need to give the AI the full picture. Provide all the relevant code snippets, explain the file structure if it matters, and mention any key dependencies. Don’t just paste the single function that’s failing; include the code that calls it and any data structures it depends on.
-
Error: This is the “what.” Be surgically precise. Give the AI the exact error message and the full stack trace. Then, clearly describe the difference between the actual, buggy behavior and what you expected to happen. If you can quantify the problem, even better.
-
Goal: This is the “why.” Tell the AI what you’re ultimately trying to do. Are you trying to fix a hard crash, patch a subtle logic flaw, or maybe refactor the code for better performance? Your end goal helps guide the AI toward the right kind of solution.
By providing these three pieces of information, you’re turning a vague demand into a well-defined problem statement. This structure is critical for any successful ai code debug session because it helps the AI zero in on the most likely cause of the issue.
Think of it like filing a bug report for a human colleague. You wouldn’t just DM them, “it’s broken.” You’d provide steps to reproduce, the error log, and a clear description of what you expected to happen. The AI needs that exact same level of detail to be helpful.
Prompting: Before and After
Seeing this method in action makes its power obvious. Let’s walk through a super common scenario: an async JavaScript bug where data just isn’t showing up.
The “Before” Prompt (What most people do):
“My fetchData function isn’t working. The component doesn’t get the data. Here’s the code. Fix it.”
This prompt is a recipe for a bad time. It’s missing the error message, the context of how fetchData is even being called, and a clear objective. The AI is left with no choice but to make a wild guess, maybe by randomly adding a .catch() block or suggesting a change to the API endpoint.
The “After” Prompt (Using Context-Error-Goal):
“Context: I have a React component that calls fetchData inside a useEffect hook. Here is the component code and the fetchData utility function it imports.
// component.js snippet…
// utils.js snippet…
Error: When the component mounts, the browser console throws a TypeError: Cannot read properties of undefined (reading 'map'). I can see in the network tab that the API call is successful (200 status), but the component’s data state remains null.
Goal: I need to fix either the fetchData function or the component’s state management so the data from the API is correctly set in state and rendered without throwing this TypeError.”
The difference is night and day. This prompt provides the context of the React component lifecycle, the exact error, and a crystal-clear goal. Now, the AI has enough information to correctly diagnose the issue—it’s almost certainly a race condition or a mistake in how the promise resolution is being handled—and give you a truly useful suggestion.
Debugging Prompt Effectiveness Framework
To make this even clearer, I’ve put together a quick comparison table showing how to apply this thinking to different types of bugs.
This table highlights how providing rich context transforms your prompts from simple requests into powerful problem statements that guide the AI toward the right solution.
| Scenario | Ineffective Prompt (Low Context) | Effective Prompt (High Context) |
|---|---|---|
| API Data Fetching | “My API call isn’t working. Here’s my fetch code.” | “Context: React useEffect hook. Error: TypeError: undefined is not a function. Goal: Fetch data and set state without errors.” |
| CSS Layout Issue | “This button is in the wrong place. Here’s the CSS.” | “Context: Flexbox container with 3 child divs. Error: The 3rd div wraps to a new line on screens < 768px. Goal: Keep all 3 divs on one line.” |
| Logic Error | “The calculation is wrong. Fix this function.” | “Context: Calculating a shopping cart total. Error: The total is off by the tax amount; calculateTotal(100, 0.08) returns 100 instead of 108. Goal: Correct the logic to include tax.” |
| Database Query | “My SQL query is slow. Can you optimize it?” | “Context: PostgreSQL query with 3 joins across tables with 1M+ rows. Error: Query takes ~15 seconds to run. Goal: Optimize the query to run in under 500ms by adding the right indexes.” |
Ultimately, taking a few extra seconds to structure your prompt saves you minutes—or even hours—of debugging headaches.
Building an Iterative AI Debugging Workflow
Getting your initial prompt right is a great first step, but the real power of AI code debug sessions comes from the conversation that follows. Effective debugging isn’t about finding one perfect prompt that magically fixes everything. It’s a back-and-forth process, a dialogue with your AI assistant that happens right inside your editor.
This transforms the AI from a simple code generator into a true pair programmer. You bring the project context and your critical eye; the AI brings lightning-fast analysis and a fresh perspective. The key is to create a tight feedback loop where you’re in the driver’s seat, guiding the AI toward the best solution instead of just taking its first suggestion. This keeps you in control, helps you learn, and makes sure the final fix is a solid one.
The Isolate-Prompt-Evaluate-Refine Loop
I’ve found the most effective way to structure this conversation is with a simple, repeatable loop. It’s a method for systematically breaking down a problem with your AI assistant, whether you’re using an in-editor chat in VS Code or a more deeply integrated tool like Cursor.
Here’s how it works:
-
Isolate the Problem: Before you even think about writing a prompt, do a little detective work yourself. Pinpoint the exact function or module where the bug is happening. Can you reproduce it reliably? The more you narrow down the scope, the better the AI can help.
-
Craft a High-Context Initial Prompt: Now it’s time to bring in the AI using that Context-Error-Goal (CEG) framework we talked about. Give it the specific code snippet, the full error message, and a clear goal. A strong opening prompt like this sets the entire conversation up for success.
-
Critically Evaluate the Suggestion: The AI will offer a potential fix. Don’t just copy and paste it. Read through the proposed changes. Ask yourself: Is this fixing the root cause or just a symptom? Could this introduce any new bugs? Does it fit our team’s coding style?
-
Refine with Follow-Up Questions: This is where the magic happens. Instead of just trying the code, talk back. Ask clarifying questions. “Why did you choose this method instead of using a map?” or “How does this handle a null input?” Pushing the AI to explain its reasoning often uncovers hidden flaws or gives you a much deeper understanding of the problem.
This visual flow shows how the CEG framework kicks off the entire debugging dialogue.
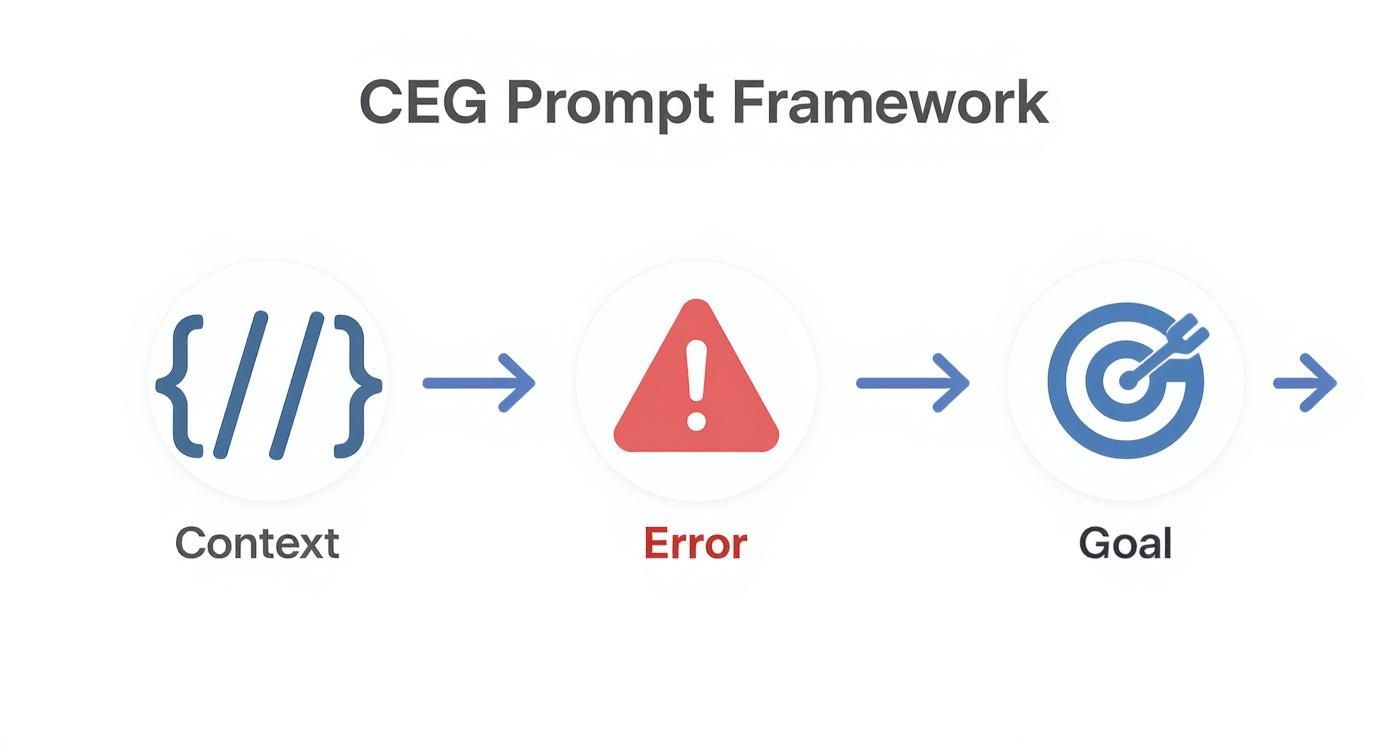
Think of this framework not as a one-and-done command, but as the first turn in a conversation that gets you to a much better solution.
Practical Tips for In-Editor Workflows
Running this loop directly inside your IDE is a game-changer. You can move from analysis to implementation without ever breaking your focus.
The goal isn’t just to fix the bug; it’s to understand why the fix works. Interrogating the AI’s suggestions is how you turn a simple debugging task into a valuable learning opportunity.
And one last thing: always, always run your test suite after applying an AI-suggested fix. This is your ultimate safety net. No matter how confident you or the AI might be, your tests are the final authority on whether your code is ready for production. This whole conversational approach ensures you get the speed of AI without ever giving up your own critical judgment.
Measuring Success and Building a Team Playbook

It’s one thing to feel like AI is making you a faster developer. It’s another thing entirely to prove it’s making the whole team more effective. To get real buy-in and make this a standard practice, you have to move beyond gut feelings and get into the data.
Without measuring, you’re flying blind. You can tell your manager you feel more productive, but that doesn’t translate into a clear business case. To really show how AI debugging impacts the bottom line, you need to track the right things. For a deeper dive on this topic, this technical guide to engineering productivity measurement is a great resource.
Key Metrics for AI Code Debug
To show how valuable these AI workflows are, you’ll want to focus on a few key performance indicators (KPIs) that connect directly to your team’s speed and the quality of your code.
- Time to Resolution (TTR): This is the classic. How long does it take from the moment a bug is flagged to when the fix gets merged? Tracking TTR for bugs fixed with AI versus those fixed the old-fashioned way will give you a direct comparison of the speed gains.
- AI Suggestion Acceptance Rate: How often are the AI’s suggestions actually used? A high acceptance rate is a great sign that your team is crafting good prompts and getting genuinely helpful solutions from the assistant.
- Rework Rate: After a bug is “fixed” with AI help, how often do you have to go back and touch that same code again in the next sprint? A low rework rate shows the fixes are solid, not just quick-and-dirty patches.
These numbers tell a compelling story. When you can walk into a meeting and say, “AI-assisted debugging reduces our TTR by 20% without increasing rework,” you’ve got a powerful argument for everyone to adopt the practice.
The goal here isn’t just to track numbers for the sake of it. You want to create a feedback loop: the data shows you what’s working, which helps you refine your best practices, which in turn improves the numbers. You’re turning individual hacks into a team-wide advantage.
From Solo Wins to a Team Playbook
When a developer on your team finds the perfect prompt to solve a frustrating bug, that’s a win. But if that knowledge just disappears into their chat history, it’s a huge missed opportunity for everyone else. The real magic happens when you build a shared knowledge base—a playbook of proven debugging strategies.
This is where a tool like Zest really shines. It can capture these successful ai code debug sessions as they happen. So, when someone figures out a clever way to handle a tricky null pointer exception, that entire conversation—the prompts, the code snippets, the AI’s response—can be saved as an “AI Hint.”
This turns a single developer’s solution into a reusable “cheatcode” for the entire team. The next person who runs into that same bug doesn’t have to start from square one. They can pull up a workflow that’s already been tested and proven to work. It’s about building a library of your team’s collective wisdom.
This mindset is just as valuable for other parts of the development cycle, like improving pull requests. You can learn more about applying similar AI strategies in our guide to AI code review. By creating this shared playbook, you make the current team faster and create an incredible onboarding resource for new engineers, getting them up to speed with your team’s best practices from their very first day.
Navigating the AI Productivity Paradox
https://www.youtube.com/embed/yMOmmnjy3sE
A lot of developers I talk to feel like they’re running in place. We were all sold on AI coding assistants as a magic bullet for speed, but the day-to-day reality often feels more like a frustrating loop of fixing subtle, “almost right” code.
This isn’t just a gut feeling; it’s a real productivity paradox. The time we think we’re saving on the front end gets eaten up by tedious debugging on the back end.
The data backs this up. While a staggering 84% of developers are using or planning to use AI tools, trust in the code they spit out has taken a nosedive. Many of us are finding that the rework needed to fix AI-generated bugs is starting to cancel out the initial time savings. It’s a classic productivity trap. You can dig into the numbers and growing skepticism in these recent developer survey findings.
This problem hits senior engineers particularly hard, pulling them away from high-impact work to constantly review and correct AI output.
Finding a Balanced Strategy
So, what’s the answer? It’s not to ditch AI assistants entirely. The trick is to get smarter about how we weave them into our daily workflow. It really comes down to knowing what AI is great at and where human expertise is still absolutely essential.
Here’s a practical way I’ve learned to think about it:
- Delegate the Grunt Work to AI: Let your AI assistant handle the boilerplate, churn out unit tests, convert data formats, or generate simple utility functions. These are low-risk, high-reward tasks where AI truly shines.
- Keep Complex Logic in Human Hands: When you’re dealing with core application architecture, tricky business logic, or security-critical code, a human needs to be in the driver’s seat. Your deep understanding of the project’s context is something AI just can’t replicate.
The best developers I know aren’t replacing their skills with AI; they’re augmenting them. They treat AI as an accelerator, not a substitute for their own critical thinking.
By drawing this clear line in the sand, you can tap into the real power of AI without getting burned by the hidden costs. This strategic mindset makes sure your ai code debug efforts are focused and effective, flipping the productivity paradox into a real, measurable win.
Frequently Asked Questions About AI Code Debug
Diving into AI-assisted debugging usually sparks a few questions. Let’s get right into the practical answers developers ask when they start bringing AI into their debugging workflow.
What Makes a Good AI Debug Prompt?
Context is everything. Seriously, it’s the most critical piece. A good prompt gives the AI the full picture, which means including:
- The problematic code snippet.
- The functions or classes it interacts with.
- The exact error message and stack trace.
- A clear, plain-language description of what you expected to happen versus what actually happened.
Without that rich context, any AI code debug attempt is really just a shot in the dark.
Can I Trust AI for Security Fixes?
Tread very carefully here. An AI can be great at spotting common vulnerabilities and suggesting patches, but it can just as easily introduce new problems or offer a fix that only papers over the cracks.
Always treat AI-generated security suggestions as a starting point, never the final word. Every single recommendation needs to be scrutinized by a human developer and run through your standard security scanning tools before it ever gets close to production.
Security is one area where human oversight is non-negotiable. An AI can be a helpful partner in identifying potential issues, but the final responsibility for code security always rests with the developer.
How Do I Integrate This on My Team?
The best way to get started is to begin small and focus on sharing what works. Encourage your team to try out the AI chat in their IDE for more straightforward bugs first.
When someone has a breakthrough and solves a tricky problem, use a tool to capture that entire session. Share it as a reusable “cheatcode” for the rest of the team. This slowly builds up an internal library of proven prompts and successful workflows, helping everyone adopt best practices that you know actually work. For a deeper look into the tools that make this possible, this comprehensive guide to AI code debuggers is an excellent resource.
Ready to stop treating AI debugging like a random experiment and start building a repeatable, measurable playbook for your team? With Zest, you can capture what works, share it instantly, and get clear data on your productivity gains. Start your free trial at https://meetzest.com today.
Master Your AI Debugging Workflow
Turn individual hacks into a team-wide advantage by creating a playbook of proven debugging strategies.
📊 Core Metrics
- Time to Resolution (TTR) — Reduction in time from bug report to merged fix using AI.
- Suggestion Acceptance Rate — Percentage of AI suggestions that are committed vs. discarded.
- Rework Rate — Frequency of re-opening bugs that were "fixed" with AI assistance.
🕹️ My Cheatcodes
- 🌱 Context-Error-Goal — Frame every prompt with what's happening, what's broken, and what you want.
- 🦎 Iterate, Don't Accept — Treat the AI's first response as a draft and refine it with follow-up questions.
- ⚡ Validate with Tests — Always run your full test suite after applying an AI-suggested fix.
✅ Before Merging an AI Fix
- 🔍 Validate the logic and check for edge cases.
- 📊 Run the complete test suite to catch regressions.
- 🧭 Ask the AI to explain its reasoning to ensure understanding.
- 📈 Save the successful prompt/workflow for the team playbook.
Gallery
Lemon shots



