A Guide to Agile Velocity Tracking

Agile velocity tracking is all about figuring out how much work your development team can consistently get done in a sprint. It’s not a magic number, but it’s a powerful way to get a data-driven look into your team’s sustainable pace. This helps you ditch the guesswork and start making commitments you can actually keep.
Understanding Agile Velocity and Why It Matters

At its heart, agile velocity is a simple measure of output. It’s not a tool for judging performance or comparing teams. Think of it as a team’s speedometer, showing a steady cruising speed—not a measure of how hard the engine is revving.
The whole point is to answer one crucial question: “How much work can we reliably finish in a typical sprint?” Once you have that answer, project management becomes a whole lot clearer.
Tracking velocity gives you a realistic picture of your team’s capacity, which is the bedrock of accurate sprint planning and predictable long-term forecasting. For a closer look at how velocity fits into the bigger picture, check out this a practical guide to agile project planning.
From Guesswork to Confident Commitments
Let’s be honest, we’ve all been on teams that plan sprints based on gut feelings. They might overcommit, leading to burnout and missed deadlines. Or they undercommit, and you’re left wondering what could have been. In both cases, stakeholders get vague timelines, which just creates friction and uncertainty.
Now, imagine that same team after they’ve tracked their velocity for a few sprints. They know they consistently complete around 25 story points each time. This one piece of data changes everything:
- Realistic Planning: They can pull about 25 points into the next sprint with confidence, knowing it’s an achievable goal.
- Transparent Conversations: When a stakeholder asks for a feature estimated at 40 points, the team can clearly explain it will likely take two sprints, using real data to back up their forecast.
- Improved Morale: The team avoids the stress of being constantly overworked and gets the satisfaction of predictably meeting their commitments.
The Power of Averages
So how do you actually calculate it? You simply add up the story points for all the work your team fully completed in a sprint. To get a stable number, you then average that total over the last three to five sprints. This rolling average smooths out the inevitable bumps and dips, giving you a much more reliable number for planning.
To get started, you’ll need a few key things in place. This table breaks down the essentials for building a solid velocity tracking process from the ground up.
Core Components of Velocity Tracking
| Component | Description | Why It’s Important |
|---|---|---|
| Consistent Sprints | Sprints of a fixed length, typically 1-4 weeks, that are repeated without change. | Provides a stable timebox for measuring the amount of work completed. |
| Story Points | A relative unit of measure for estimating the effort required to complete a user story. | Allows the team to size work consistently without getting hung up on hours. |
| Backlog Grooming | Regularly refining and estimating items in the product backlog. | Ensures stories are well-understood and ready for the team to work on. |
| Definition of Done | A clear, shared understanding of what it means for a story to be complete. | Prevents half-finished work from being counted and ensures quality. |
With these elements in hand, you have a repeatable system for measuring and understanding your team’s output.
Key Takeaway: Velocity isn’t about pushing your team to go faster; it’s about finding a predictable, sustainable rhythm. This predictability builds trust, empowers your team, and helps everyone make smarter, data-informed decisions.
How to Calculate and Track Your Velocity
Figuring out your agile velocity isn’t rocket science, but it absolutely requires discipline. If you want a number you can actually rely on, you have to nail two things first: consistent story point estimation and a rock-solid Definition of Done. Get these wrong, and your velocity metrics will be more misleading than helpful.
Remember, story points are about relative effort and complexity, not hours logged. Your team needs a shared understanding of what a “one-point” task feels like compared to a “five-point” beast. At the same time, your Definition of Done has to be a strict, non-negotiable checklist. A story is either 100% finished—tested, reviewed, and ready to ship—or it’s not. There’s no partial credit; an unfinished story contributes zero points to the sprint total.
The Basic Calculation
Once a sprint wraps up, the math is simple. Just add up the story points for every single user story that meets your Definition of Done.
Let’s look at a quick example. A team just finished a two-week sprint and managed to complete these stories:
- User Authentication Feature: 8 points
- Fix Login Page Bug: 3 points
- Update API Documentation: 2 points
- Refactor Payment Module: 5 points
The total comes out to 18 story points. That’s your velocity for this sprint. But a single data point isn’t a trend. One sprint can easily be an outlier—maybe there was a holiday, a critical bug popped up, or the work was just unusually straightforward. For real agile velocity tracking, you need an average.
The gold standard is to calculate a rolling average over the last three to five sprints. This approach smooths out the peaks and valleys, giving you a much more stable and predictable number for future planning.
Establishing a Rolling Average
Let’s stick with our example team. Here’s what their completed story points look like over the last four sprints:
- Sprint 1: 18 points
- Sprint 2: 22 points
- Sprint 3: 16 points
- Sprint 4: 20 points
To get their average velocity, you just sum the totals and divide by the number of sprints: (18 + 22 + 16 + 20) / 4 = 19 points. That’s the number they should use to forecast what they can realistically take on in the next sprint. For any team running Scrum, mastering Scrum Project Tracking is essential, and velocity is one of the most practical metrics for keeping a pulse on progress.
Tools for Tracking Velocity
You don’t need to buy expensive software right away, but the right tool can certainly make life easier.
- Spreadsheets: If your team is just starting out, a simple spreadsheet works perfectly. Set up columns for each sprint, log the completed points, and you’re good to go. It’s a low-cost way to get everyone familiar with the fundamentals.
- Integrated Project Management Tools: Platforms like Jira, Azure DevOps, or ClickUp handle all of this for you. They automatically generate velocity charts from your completed work, which saves a ton of time and cuts down on manual errors. The visual dashboards are also great for spotting trends at a glance.
No matter what tool you land on, consistency is what matters most. Sticking to your process for estimating and closing out stories is what transforms velocity from just another number into a truly powerful planning tool.
For a deeper dive into the specifics, check out our complete guide on how to measure velocity.
How to Read Velocity Charts and Spot Trends
Collecting the data for your agile velocity is the easy part. The real skill—and where the value truly lies—is in understanding the story that data is telling you. A velocity chart is much more than a historical record; think of it as a diagnostic tool for your team’s health and the efficiency of your workflow. Once you learn to spot the patterns, you can shift from just tracking numbers to making real, meaningful improvements.
Take a look at the chart below. It shows a team’s velocity over three sprints, with some minor ups and downs, which is perfectly normal.
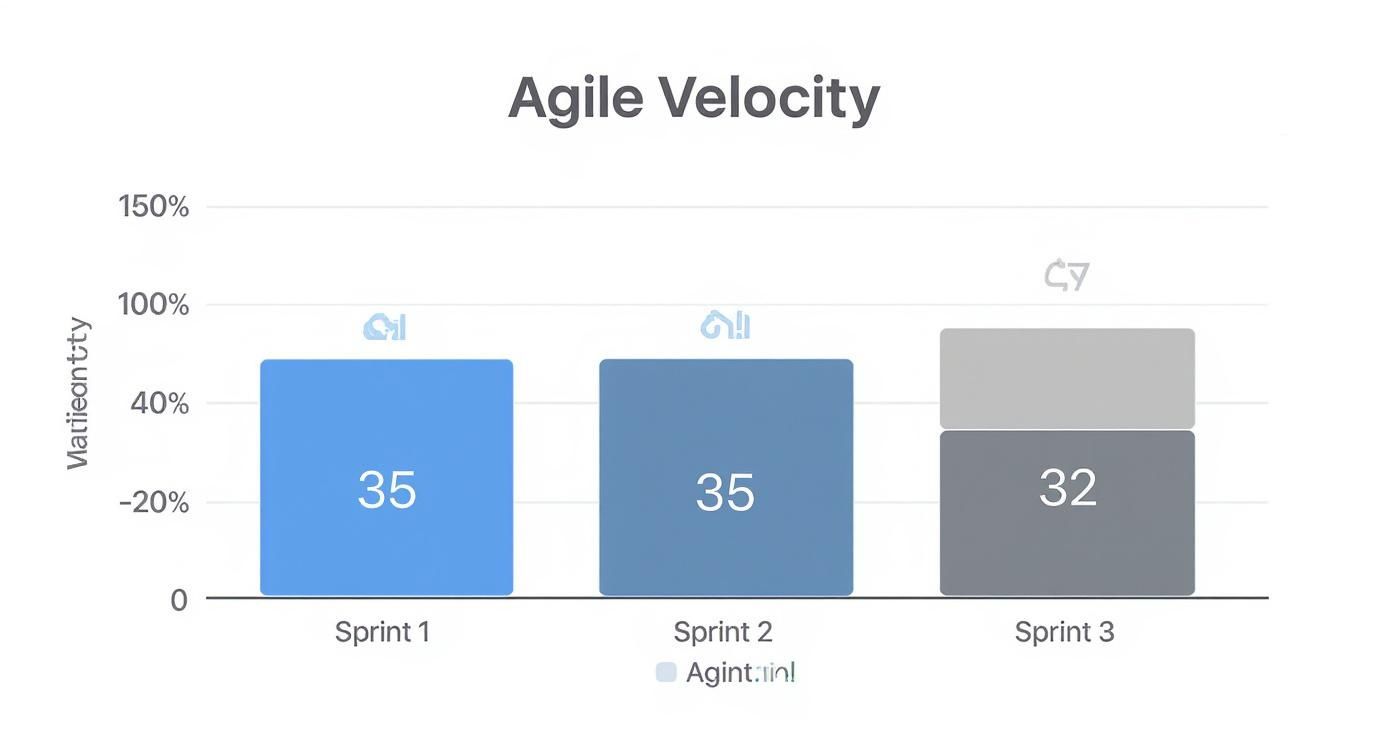
This kind of visualization tells us the team is delivering a fairly consistent amount of work. That stability is gold because it makes their future capacity much more predictable.
Identifying Key Velocity Patterns
When you look at your velocity chart over time, you’ll likely see one of four common trends emerge. Each pattern is a signal, telling a specific story about what’s going on with your team and your process. Recognizing these signals is the first step toward asking the right questions.
- Stable Velocity: This is what you’re aiming for. A chart that shows minor fluctuations around a steady average means you have a predictable team working at a sustainable pace. It’s a great sign that your planning is on point and your process is solid.
- Increasing Velocity: A steady upward trend often points to a team that’s really gelling, mastering its domain, or seeing the benefits of recent process improvements. It’s a fantastic sign, but you’ll want to make sure it’s genuine and not just “story point inflation.”
- Decreasing Velocity: A consistent downward slide is a red flag. This pattern often signals growing technical debt, persistent blockers, or even team burnout. It’s a clear sign that some kind of friction is slowing everyone down.
- Volatile Velocity: Seeing wild swings from one sprint to the next—a huge peak followed by a deep valley—screams instability. This is often caused by poorly defined requirements, constant interruptions from outside the sprint, or inconsistent sizing of stories.
Connecting Trends to Root Causes
Once you’ve spotted a pattern, the real work begins: diagnosing the underlying cause. Your velocity chart shows you what is happening, but it’s up to your team to investigate the why.
A volatile velocity chart is often a symptom of external chaos bleeding into the sprint. If the team is constantly pulled into “urgent” tasks or if requirements change mid-sprint, their ability to deliver committed work predictably will suffer.
To get a more reliable average, some teams will collect data from 6 to 8 sprints, then toss out the highest and lowest values before calculating. This method smooths out the anomalies, like a sprint derailed by a holiday or an unexpected outage, giving you a truer picture of your team’s capacity. You can learn more about these agile velocity calculations to improve your own forecasting.
Turning Insights into Action
Interpreting the data is only half the battle; you have to act on it. Use what you’ve learned as a centerpiece for your team’s next retrospective.
- If velocity is trending down: It’s time to have a serious talk about technical debt. Should you schedule a refactoring sprint? Are the code reviews catching what they need to?
- If velocity is volatile: Dig into the source of interruptions. Can you create a better process for handling unplanned work? Does the Product Owner need to do more to protect the sprint goals?
By systematically analyzing your velocity trends, you turn a simple metric into a powerful conversation starter for continuous improvement. Keep in mind, this is just one of several key engineering performance indicators that, when combined, give you a complete picture of your team’s effectiveness.
Common Velocity Tracking Mistakes to Avoid
https://www.youtube.com/embed/x9RQGa0FajU
Velocity is a fantastic tool for planning, but it’s also one of the most abused metrics in the agile world. If you’re not careful, it can go from a helpful guide to a weapon that tanks morale and encourages all the wrong behaviors. To keep it useful, you have to steer clear of a few common, but serious, pitfalls.
The single biggest mistake I see teams make is using velocity to compare different teams. It’s so tempting, but it’s a completely flawed idea.
Think of story points as a currency with no exchange rate. Team A’s “five-point” story is based on their unique skill set, their shared history, and their specific understanding of complexity. Team B’s “five-point” story is based on a totally different context. Comparing their velocity is like saying 5 US dollars is the same as 5 Japanese yen—it just doesn’t make any sense and always leads to unfair judgments.
The Problem with Performance Metrics
Just as bad is treating velocity as a way to measure individual performance. The second you tie velocity to performance reviews, the game is over.
That pressure immediately kills the psychological safety a team needs to estimate honestly and work together. You’ll see developers start padding story points to look more “productive.” Or worse, they’ll stop helping each other out to focus on closing their own tickets. Real agile velocity tracking is about understanding the team’s output, not crowning individual heroes.
Velocity is a measure of a team’s predictable output, not a weapon for performance management. Using it to rank individuals or teams guarantees it will be gamed, rendering the data useless.
Ignoring Critical Context
Another trap is looking at the numbers in a vacuum. A dip in velocity doesn’t automatically mean there’s a problem, especially if you know the context behind it.
To get the real story, you always have to consider what’s happening in the real world. A few things that will always impact a sprint’s outcome include:
- Team Absences: Holidays, sick days, and personal time off obviously reduce your team’s capacity. You can’t expect the same output when two of your engineers are on vacation for a week.
- Team Composition Changes: When a new person joins, velocity will probably dip for a bit while they get up to speed. When someone leaves, capacity is lost. Any time the team changes, you need to let a few sprints pass to establish a new, stable baseline.
- Unplanned Work: A critical production bug can throw a wrench in even the most perfect sprint plan. That work is essential, but it wasn’t part of the original commitment and will absolutely affect the team’s velocity.
Forgetting about these variables just leads to bad conclusions. The goal isn’t to hit an exact number every single time. It’s to understand your team’s capacity under normal conditions so you can plan better for the future. To protect velocity as a planning tool, you have to defend it from being turned into a simple scoreboard.
How AI Is Making Velocity Forecasts a Lot Smarter

The old way of tracking agile velocity is pretty straightforward: look at what you’ve done in the past to guess what you’ll do in the future. It’s a simple historical average, and while it’s a decent starting point, it has some serious blind spots. This method treats every past sprint as if it happened under the exact same conditions, missing all the subtle things that actually affect a team’s capacity.
This is where AI is changing the game.
AI-powered tools are moving way beyond simple averages to give us forecasts that are dynamic and actually understand context. These systems can chew through years of sprint data in seconds, spotting faint patterns a person would almost certainly miss. They don’t just see what happened; they’re starting to figure out why.
Moving Beyond Simple Averages
Think about it. What if your forecasting tool knew your senior backend developer is taking a two-week vacation? An AI model can look back at every time a key team member was out and adjust its forecast based on that history. It can even learn that a sprint packed with complex new features will have a different output than one filled with quick bug fixes.
This is a huge leap. It turns velocity from a backward-looking metric into a forward-looking planning tool. AI algorithms can juggle dozens of variables at once:
- Team Composition: It can automatically account for planned time off, new hires joining the team, or people leaving.
- Task Complexity: The system learns to tell the difference between a sprint full of high-risk stories and one full of simple, low-effort tasks.
- Historical Patterns: It can pick up on recurring trends, like the common slowdown that happens during the last week of a business quarter.
Proactive Planning with Intelligent Insights
This smarter approach to agile velocity tracking adds a whole new layer of confidence to your planning. Instead of just giving you a single number, AI can offer a probabilistic forecast. For example, it might tell you there’s an 85% chance of completing 25 story points but only a 50% chance of hitting 30. This kind of nuanced data is gold for product owners trying to make realistic commitments.
The impact here is real. We’ve seen that AI-enabled platforms can improve long-term project completion date predictions by up to 15% over traditional manual methods. It’s about analyzing historical velocity, identifying patterns, and predicting how things like team changes or different types of work will affect the outcome.
Key Insight: AI forecasting doesn’t replace the team’s judgment; it enhances it. By handling the complex data analysis, it frees up the team to focus on strategic discussions about priorities and risks.
This shift toward intelligent forecasting is part of a bigger trend where AI is becoming a core part of the development lifecycle. For more on this, check out our guide on how to best use AI for code to improve both productivity and quality. At the end of the day, AI-driven forecasting gives teams more confidence in their sprint commitments and gives stakeholders more trust in the project timeline.
Answering Your Questions About Agile Velocity
Even when you’ve got the basics down, tracking agile velocity in the real world throws up some tricky questions. Let’s tackle some of the most common ones I hear from teams, so you can stop guessing and start using this metric with confidence.
What Should We Do If Our Velocity Is All Over the Place?
First off, don’t panic. An unstable velocity isn’t a sign of failure; it’s a signal that something needs a closer look. Think of it as a symptom, and your job is to find the cause. The best place to start this investigation is your team retrospective.
Get together and ask some honest questions:
- Are our user stories well-defined and small enough when we pull them into a sprint?
- Are we constantly getting sidetracked by unplanned work or urgent bugs?
- Is “scope creep” a problem, with new requirements getting added after the sprint has already started?
Once you pinpoint the source of the volatility, you can start working on solutions. Maybe you need to tighten up your backlog refinement process to make sure stories are genuinely “ready.” Or perhaps it’s time to create a clear process for handling urgent requests so they don’t blow up the sprint plan. Your Product Owner is your best ally here—their job is to protect the sprint from changes once it’s locked in.
Can We Actually Use Velocity to Predict When a Project Will Be Done?
Yes, you can, but you have to be careful. Velocity shines as a short-term planning tool for the next sprint or two, but it can be stretched for longer-term forecasting.
The basic math is simple: take the total story points left in your project backlog and divide that by your team’s average velocity.
A Quick Forecasting Example: If your backlog has 200 story points remaining and your team consistently delivers around 20 points per sprint, you can estimate it will take about 10 more sprints to finish.
But here’s the crucial part: this is a forecast, not a promise. I always advise presenting this as a range, like “we’re tracking towards completion in 9 to 11 sprints.” This simple shift in language accounts for the natural ebb and flow of development and gives stakeholders a much more realistic timeline. It builds trust, whereas a single, rigid date often just sets everyone up for disappointment.
How Do Team Changes Mess with Our Velocity?
Anytime you change the lineup, you can bet it’s going to impact your velocity. When a new person joins, expect a temporary dip. They need time to learn the codebase, the product, and how the team works together. When someone leaves, the team’s capacity is obviously reduced, so velocity will naturally go down.
After any significant change to the team, you should treat all your previous velocity data as history. You’re essentially working with a new team now. It will take a little while, usually 3-5 sprints, for the group to find its rhythm and establish a new, reliable velocity.
It’s incredibly important to communicate this to your stakeholders. Let them know why the forecasts are shifting and why the team’s output has changed. A little transparency goes a long way in preventing misunderstandings and keeping everyone aligned.
Master Agile Velocity Tracking
Turn velocity from a simple metric into a powerful tool for predictable planning and continuous improvement.
📊 Core Metrics
- Average Velocity — Rolling average of completed story points over the last 3-5 sprints.
- Commitment Reliability — Percentage of planned story points actually completed per sprint.
- Velocity Volatility — The standard deviation or range between highest and lowest sprint totals.
🕹️ My Cheatcodes
- 🌱 Context Over Numbers — Always analyze velocity alongside team changes, holidays, and unplanned work.
- 🦎 Never Compare Teams — Treat velocity as a team's internal speedometer, not a cross-team leaderboard.
- ⚡ Forecast in Ranges — Use velocity to provide stakeholders with a probable range (e.g., 9-11 sprints), not a single date.
📈 Reflection Points
- 💡 Is our velocity unstable due to poorly defined stories or frequent interruptions?
- 🧩 Could a downward trend be a signal of growing technical debt or team burnout?
- 📘 Do we reset our velocity baseline and stakeholder expectations after any team changes?
Gallery
Lemon shots